29
/
en
AIzaSyAYiBZKx7MnpbEhh9jyipgxe19OcubqV5w
April 1, 2024
89029
Bosnia and Herzegovina
BIH
true
2
1
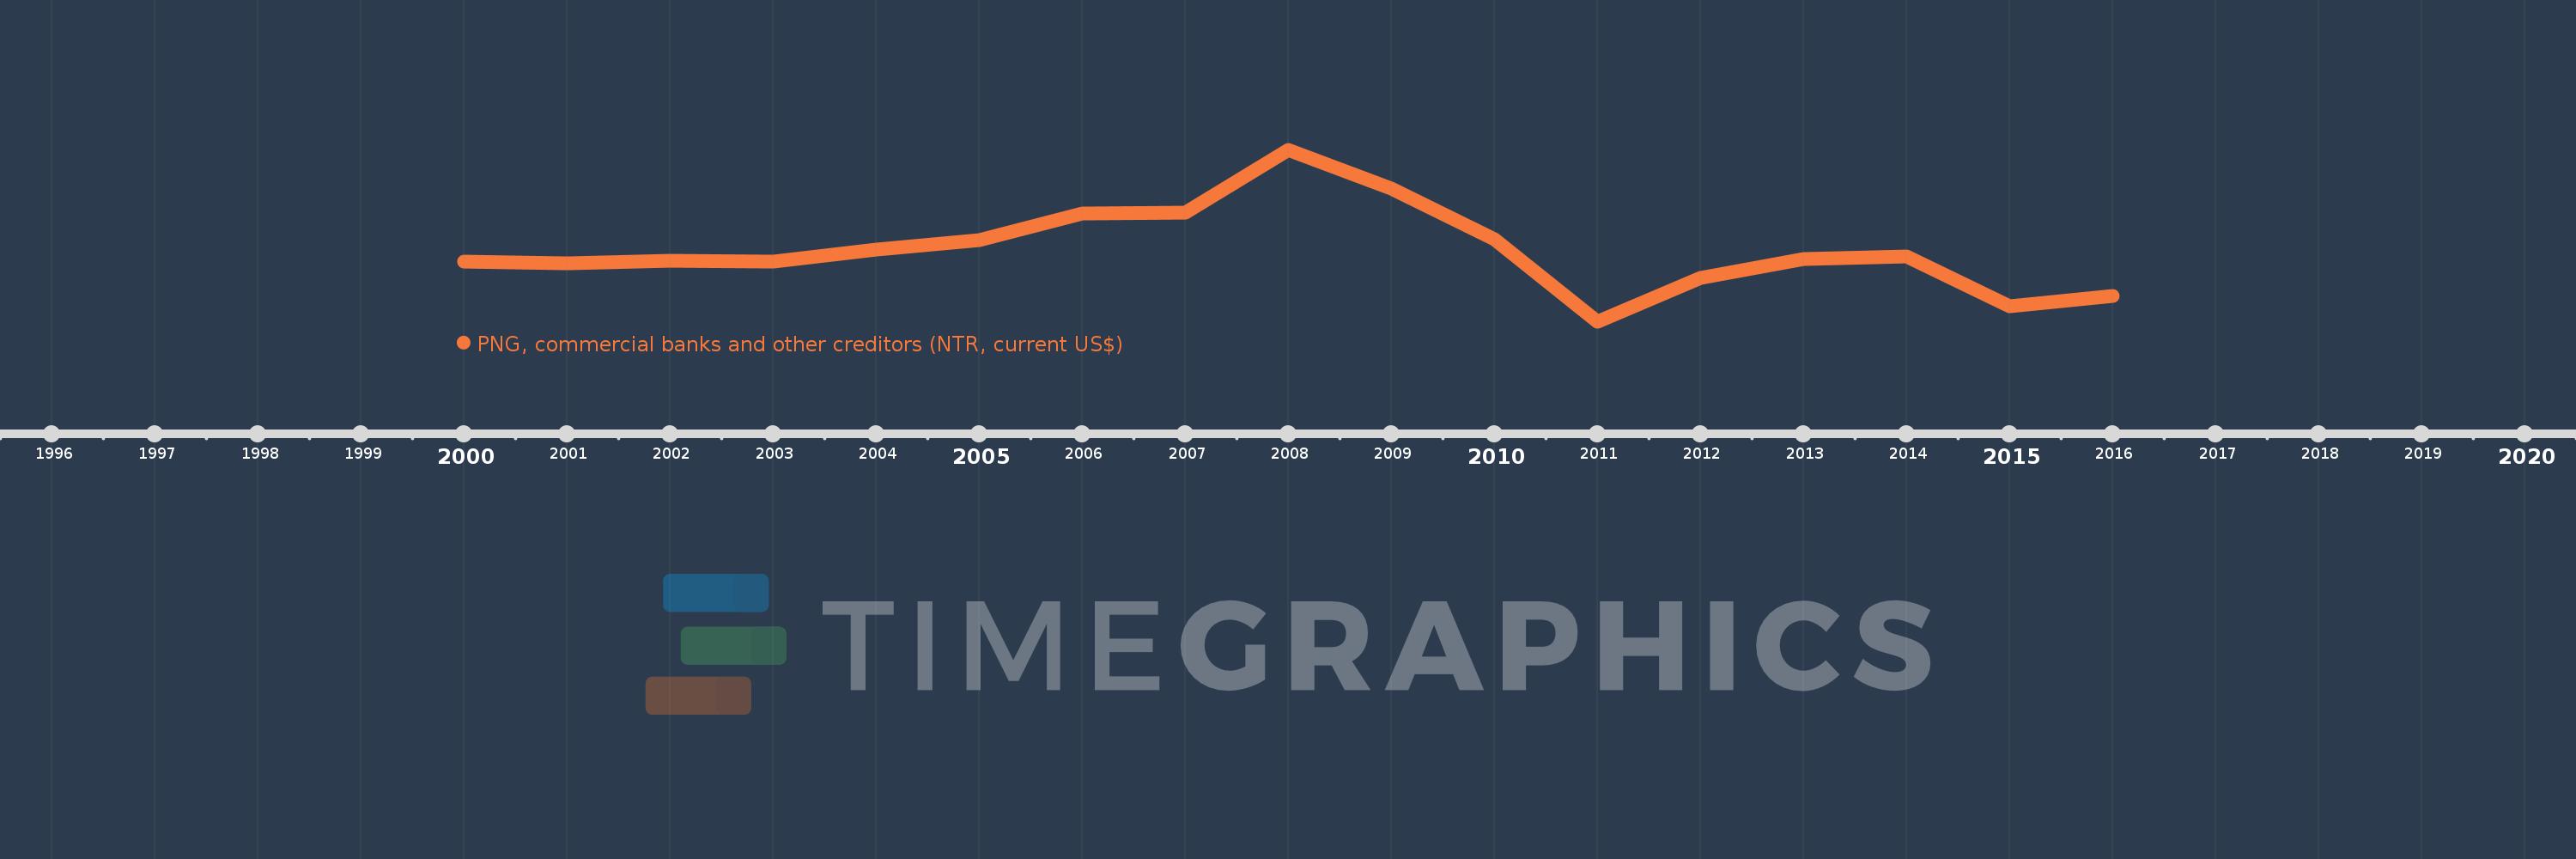
PNG, commercial banks and other creditors (NTR, current US$)
2016,2015,2014,2013,2012,2011,2010,2009,2008,2007,2006,2005,2004,2003,2002,2001,2000
This statistics in other country:
Timeline:
This timeline shows a graph from 2000 to 2016 of Bosnia and Herzegovina. No data until 1999. Number of actual observations by date: 17.
Source name:
World Development Indicators
Source organization:
World Bank, International Debt Statistics.
Categories, topics:
External Debt
Last updated:
apr 23, 2017
Indicators value changes by year
Minimum:
-1.269 bln
jan 1, 2011
Maximum:
2.351 bln
jan 1, 2008
At the date of observation
Value
Absolute change
Change from previous value
jan 1, 2000
-160.0K
-160.0K
0.0%
jan 1, 2001
-26.775 mln
-26.615 mln
16.63K%
jan 1, 2002
17.447 mln
+44.222 mln
-165.16%
jan 1, 2003
7.302 mln
-10.145 mln
-58.15%
jan 1, 2004
253.107 mln
+245.805 mln
3.37K%
jan 1, 2005
458.791 mln
+205.684 mln
81.26%
jan 1, 2006
1.015 bln
+556.042 mln
121.2%
jan 1, 2007
1.035 bln
+20.624 mln
2.03%
jan 1, 2008
2.351 bln
+1.315 bln
127.0%
jan 1, 2009
1.551 bln
-799.985 mln
-34.03%
jan 1, 2010
468.634 mln
-1.082 bln
-69.78%
jan 1, 2011
-1.269 bln
-1.737 bln
-370.75%
jan 1, 2012
-343.503 mln
+925.33 mln
-72.93%
jan 1, 2013
60.174 mln
+403.677 mln
-117.52%
jan 1, 2014
120.232 mln
+60.058 mln
99.81%
jan 1, 2015
-935.083 mln
-1.055 bln
-877.73%
jan 1, 2016
-729.061 mln
+206.022 mln
-22.03%
Ranking of countries by current statistics by years


Comments: