29
/
en
AIzaSyAYiBZKx7MnpbEhh9jyipgxe19OcubqV5w
April 1, 2024
81031
Belarus
BLR
true
2
1
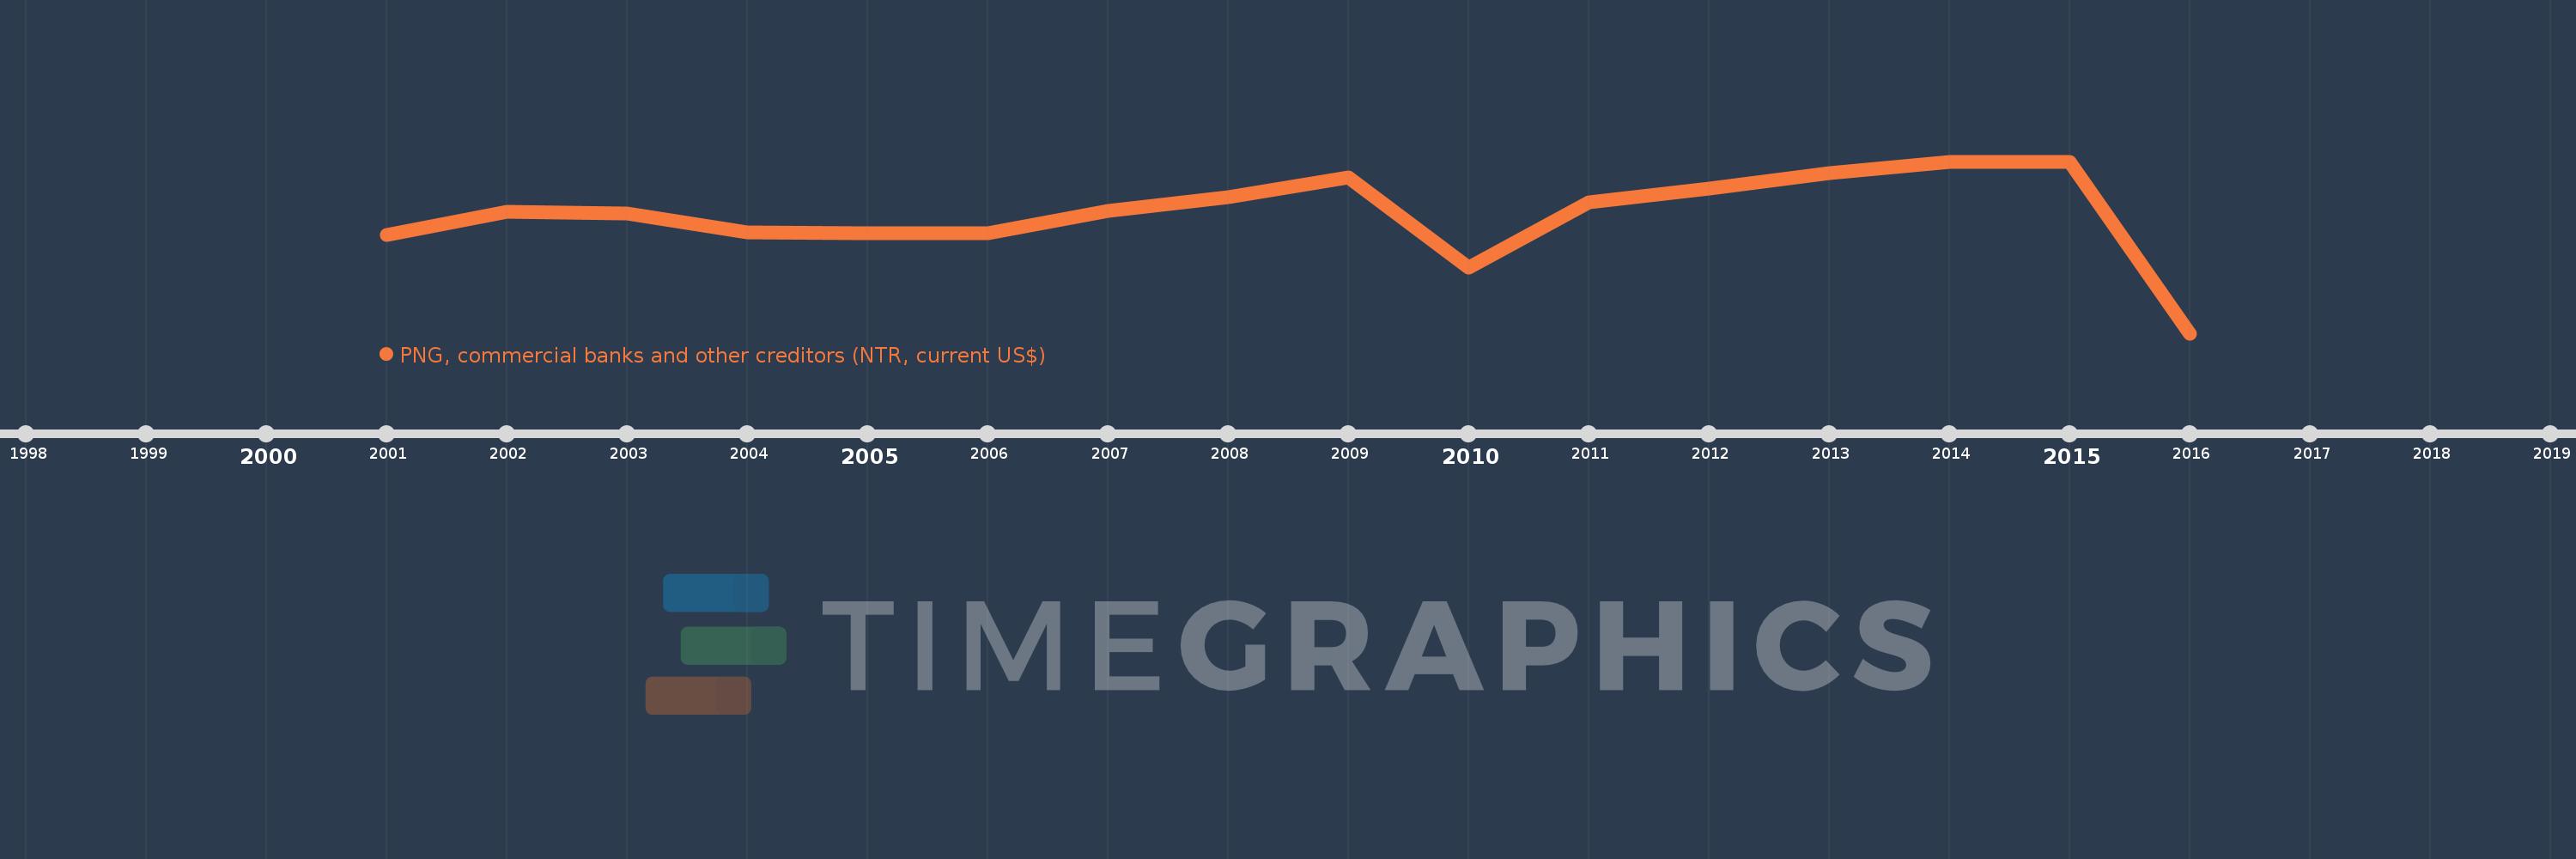
PNG, commercial banks and other creditors (NTR, current US$)
2016,2015,2014,2013,2012,2011,2010,2009,2008,2007,2006,2005,2004,2003,2002,2001
This statistics in other country:
Timeline:
This timeline shows a graph from 2001 to 2016 of Belarus. No data until 2000. Number of actual observations by date: 16.
Source name:
World Development Indicators
Source organization:
World Bank, International Debt Statistics.
Categories, topics:
External Debt
Last updated:
apr 23, 2017
Indicators value changes by year
Minimum:
-602.723 mln
jan 1, 2016
Maximum:
511.961 mln
jan 1, 2014
At the date of observation
Value
Absolute change
Change from previous value
jan 1, 2001
33.522 mln
+33.522 mln
0.0%
jan 1, 2002
187.516 mln
+153.994 mln
459.38%
jan 1, 2003
172.559 mln
-14.957 mln
-7.98%
jan 1, 2004
49.958 mln
-122.601 mln
-71.05%
jan 1, 2005
45.363 mln
-4.595 mln
-9.2%
jan 1, 2006
45.761 mln
+398.0K
0.88%
jan 1, 2007
191.291 mln
+145.53 mln
318.02%
jan 1, 2008
278.083 mln
+86.792 mln
45.37%
jan 1, 2009
410.006 mln
+131.923 mln
47.44%
jan 1, 2010
-175.814 mln
-585.82 mln
-142.88%
jan 1, 2011
249.054 mln
+424.868 mln
-241.66%
jan 1, 2012
338.8 mln
+89.746 mln
36.03%
jan 1, 2013
435.297 mln
+96.497 mln
28.48%
jan 1, 2014
511.961 mln
+76.664 mln
17.61%
jan 1, 2015
510.095 mln
-1.866 mln
-0.36%
jan 1, 2016
-602.723 mln
-1.113 bln
-218.16%
Ranking of countries by current statistics by years


Comments: