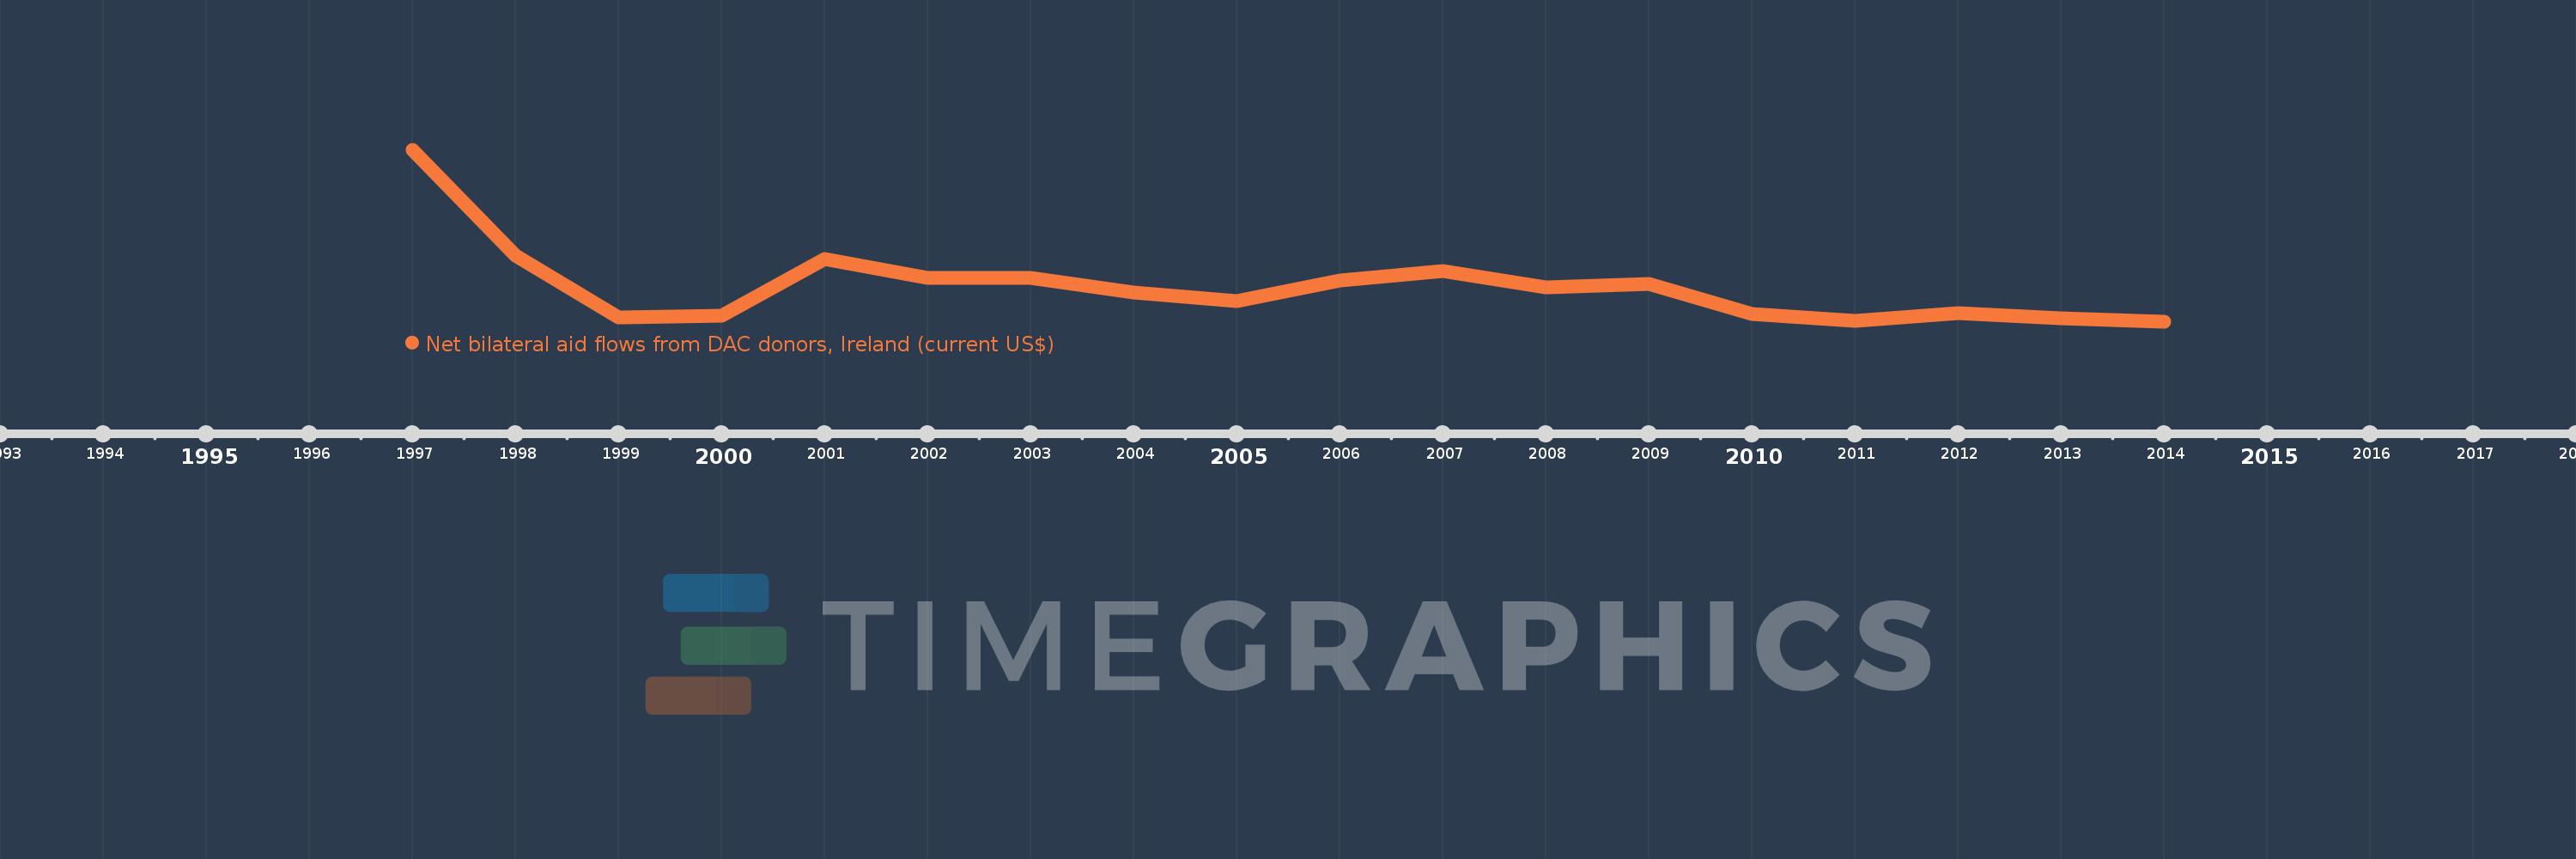
This timeline shows a graph from 1997 to 2014 of Bosnia and Herzegovina. No data until 1996. Number of actual observations by date: 18.
Source name:
World Development Indicators
Source organization:
Development Assistance Committee of the Organisation for Economic Co-operation and Development, Geographical Distribution of Financial Flows to Developing Countries, Development Co-operation Report, and International Development Statistics database. Data are available online at: www.oecd.org/dac/stats/idsonline.
Categories, topics:
Aid Effectiveness
Last updated:
apr 23, 2017
Indicators value changes by year
Meaning:
1.24 mln
Minimum:
30.0K
jan 1, 2014
Maximum:
5.91 mln
jan 1, 1997
At the date of observation
Value
Absolute change
Change from the previous value
jan 1, 1997
5.91 mln
+5.91 mln
0.0%
jan 1, 1998
2.29 mln
-3.62 mln
-61.25%
jan 1, 1999
180.0K
-2.11 mln
-92.14%
jan 1, 2000
240.0K
+60.0K
33.33%
jan 1, 2001
2.18 mln
+1.94 mln
808.33%
jan 1, 2002
1.54 mln
-640.0K
-29.36%
jan 1, 2003
1.55 mln
+10.0K
0.65%
jan 1, 2004
1.05 mln
-500.0K
-32.26%
jan 1, 2005
740.0K
-310.0K
-29.52%
jan 1, 2006
1.46 mln
+720.0K
97.3%
jan 1, 2007
1.76 mln
+300.0K
20.55%
jan 1, 2008
1.22 mln
-540.0K
-30.68%
jan 1, 2009
1.33 mln
+110.0K
9.02%
jan 1, 2010
290.0K
-1.04 mln
-78.2%
jan 1, 2011
60.0K
-230.0K
-79.31%
jan 1, 2012
340.0K
+280.0K
466.67%
jan 1, 2013
150.0K
-190.0K
-55.88%
jan 1, 2014
30.0K
-120.0K
-80.0%
Ranking of countries by current statistics by years
