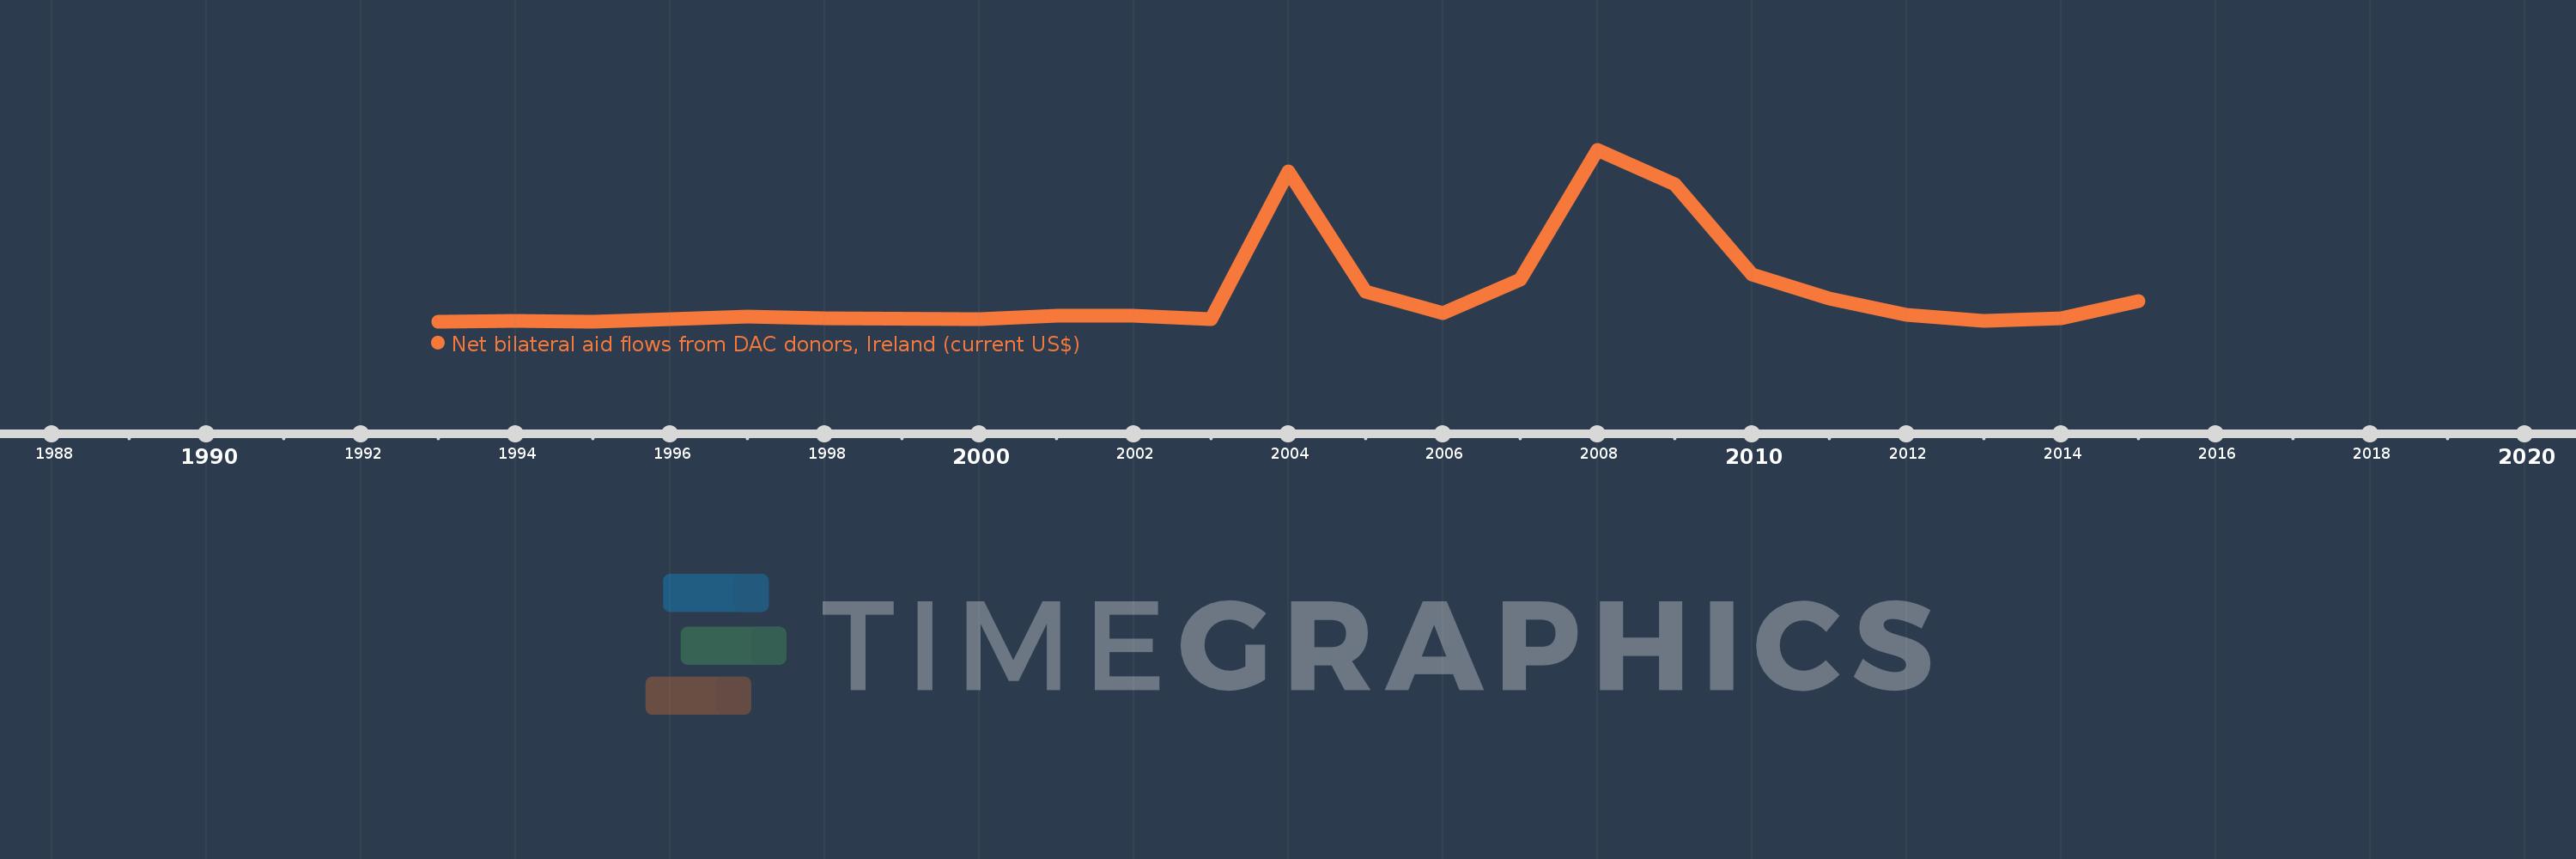
This timeline shows a graph from 1993 to 2015 of Iraq. No data until 1992. Number of actual observations by date: 22.
Source name:
World Development Indicators
Source organization:
Development Assistance Committee of the Organisation for Economic Co-operation and Development, Geographical Distribution of Financial Flows to Developing Countries, Development Co-operation Report, and International Development Statistics database. Data are available online at: www.oecd.org/dac/stats/idsonline.
Categories, topics:
Aid Effectiveness
Last updated:
apr 23, 2017
Indicators value changes by year
Meaning:
1.271 mln
Minimum:
40.0K
jan 1, 1993
Maximum:
6.92 mln
jan 1, 2008
At the date of observation
Value
Absolute change
Change from the previous value
jan 1, 1993
40.0K
+40.0K
0.0%
jan 1, 1994
70.0K
+30.0K
75.0%
jan 1, 1995
40.0K
-30.0K
-42.86%
jan 1, 1996
160.0K
+120.0K
300.0%
jan 1, 1997
240.0K
+80.0K
50.0%
jan 1, 1998
180.0K
-60.0K
-25.0%
jan 1, 2000
140.0K
-40.0K
-22.22%
jan 1, 2001
290.0K
+150.0K
107.14%
jan 1, 2002
280.0K
-10.0K
-3.45%
jan 1, 2003
150.0K
-130.0K
-46.43%
jan 1, 2004
6.08 mln
+5.93 mln
3.95K%
jan 1, 2005
1.24 mln
-4.84 mln
-79.61%
jan 1, 2006
410.0K
-830.0K
-66.94%
jan 1, 2007
1.73 mln
+1.32 mln
321.95%
jan 1, 2008
6.92 mln
+5.19 mln
300.0%
jan 1, 2009
5.54 mln
-1.38 mln
-19.94%
jan 1, 2010
1.95 mln
-3.59 mln
-64.8%
jan 1, 2011
990.0K
-960.0K
-49.23%
jan 1, 2012
340.0K
-650.0K
-65.66%
jan 1, 2013
80.0K
-260.0K
-76.47%
jan 1, 2014
200.0K
+120.0K
150.0%
jan 1, 2015
890.0K
+690.0K
345.0%
Ranking of countries by current statistics by years
