29
/
en
AIzaSyAYiBZKx7MnpbEhh9jyipgxe19OcubqV5w
April 1, 2024
85945
Bhutan
BTN
true
2
1
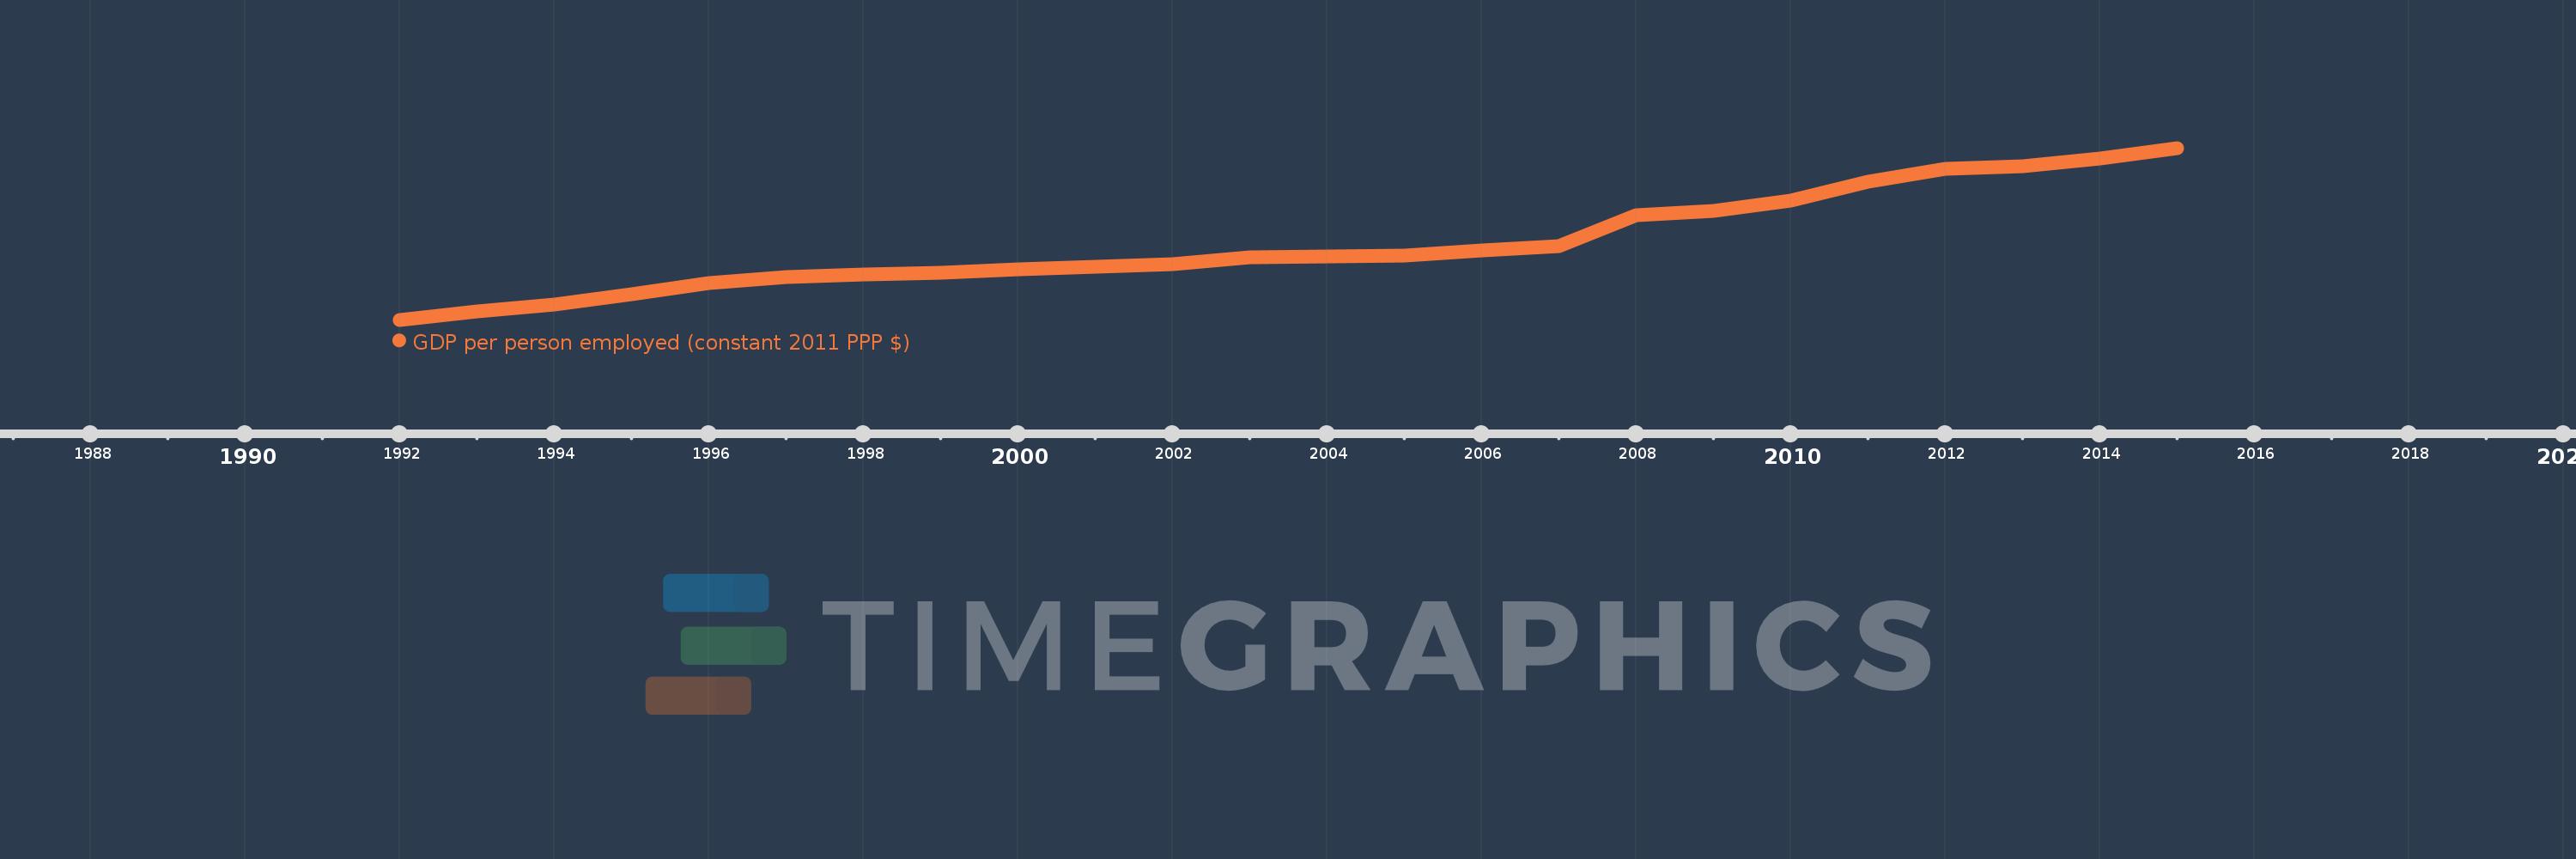
GDP per person employed (constant 2011 PPP $)
2015,2014,2013,2012,2011,2010,2009,2008,2007,2006,2005,2004,2003,2002,2001,2000,1999,1998,1997,1996,1995,1994,1993,1992
This statistics in other country:
AfghanistanAlbaniaAlgeriaAngolaArab WorldArgentinaArmeniaAustraliaAustriaAzerbaijanBahamas, TheBahrainBangladeshBarbadosBelarusBelgiumBelizeBeninBhutanBoliviaBosnia and HerzegovinaBotswanaBrazilBrunei DarussalamBulgariaBurkina FasoBurundiCabo VerdeCambodiaCameroonCanadaCaribbean small statesCentral African RepublicCentral Europe and the BalticsChadChileChinaColombiaComorosCongo, Dem. Rep.Congo, Rep.Costa RicaCote d'IvoireCroatiaCubaCyprusCzech RepublicDenmarkDominican RepublicEarly-demographic dividendEast Asia & PacificEast Asia & Pacific (excluding high income)East Asia & Pacific (IDA & IBRD countries)EcuadorEgypt, Arab Rep.El SalvadorEquatorial GuineaEritreaEstoniaEthiopiaEuro areaEurope & Central AsiaEurope & Central Asia (excluding high income)Europe & Central Asia (IDA & IBRD countries)European UnionFijiFinlandFragile and conflict affected situationsFranceGabonGambia, TheGeorgiaGermanyGhanaGreeceGuatemalaGuineaGuinea-BissauGuyanaHaitiHeavily indebted poor countries (HIPC)High incomeHondurasHong Kong SAR, ChinaHungaryIBRD onlyIcelandIDA & IBRD totalIDA blendIDA onlyIDA totalIndiaIndonesiaIran, Islamic Rep.IraqIrelandIsraelItalyJamaicaJapanJordanKazakhstanKenyaKorea, Dem. People’s Rep.Korea, Rep.KuwaitKyrgyz RepublicLao PDRLate-demographic dividendLatin America & Caribbean Latin America & Caribbean (excluding high income)Latin America & the Caribbean (IDA & IBRD countries)LatviaLeast developed countries: UN classificationLebanonLesothoLiberiaLibyaLithuaniaLow & middle incomeLow incomeLower middle incomeLuxembourgMacao SAR, ChinaMacedonia, FYRMadagascarMalawiMalaysiaMaldivesMaliMaltaMauritaniaMauritiusMexicoMiddle East & North AfricaMiddle East & North Africa (excluding high income)Middle East & North Africa (IDA & IBRD countries)Middle incomeMoldovaMongoliaMontenegroMoroccoMozambiqueMyanmarNamibiaNepalNetherlandsNew ZealandNicaraguaNigerNigeriaNorth AmericaNorwayOECD membersOmanOther small statesPakistanPanamaPapua New GuineaParaguayPeruPhilippinesPolandPortugalPost-demographic dividendPre-demographic dividendPuerto RicoQatarRomaniaRussian FederationRwandaSaudi ArabiaSenegalSerbiaSierra LeoneSingaporeSlovak RepublicSloveniaSmall statesSolomon IslandsSomaliaSouth AfricaSouth AsiaSouth Asia (IDA & IBRD)SpainSri LankaSub-Saharan Africa Sub-Saharan Africa (excluding high income)Sub-Saharan Africa (IDA & IBRD countries)SudanSurinameSwazilandSwedenSwitzerlandSyrian Arab RepublicTajikistanTanzaniaThailandTimor-LesteTogoTrinidad and TobagoTunisiaTurkeyTurkmenistanUgandaUkraineUnited Arab EmiratesUnited KingdomUnited StatesUpper middle incomeUruguayUzbekistanVenezuela, RBVietnamWest Bank and GazaWorldYemen, Rep.ZambiaZimbabwe Timeline:
This timeline shows a graph from 1992 to 2015 of Bhutan. No data until 1991. Number of actual observations by date: 24.
Source name:
World Development Indicators
Source organization:
International Labour Organization, Key Indicators of the Labour Market database.
Categories, topics:
Social Protection & Labor
Last updated:
apr 23, 2017
Indicators value changes by year
Minimum:
6.652K
jan 1, 1992
Maximum:
15.188K
jan 1, 2015
At the date of observation
Value
Absolute change
Change from previous value
jan 1, 1992
6.652K
+6.652K
0.0%
jan 1, 1993
7.071K
+418.9
6.3%
jan 1, 1994
7.412K
+340.78
4.82%
jan 1, 1995
7.911K
+498.85
6.73%
jan 1, 1996
8.47K
+559.621
7.07%
jan 1, 1997
8.793K
+322.359
3.81%
jan 1, 1998
8.918K
+125.681
1.43%
jan 1, 1999
8.966K
+47.949
0.54%
jan 1, 2000
9.17K
+203.841
2.27%
jan 1, 2001
9.271K
+100.899
1.1%
jan 1, 2002
9.432K
+160.39
1.73%
jan 1, 2003
9.736K
+304.48
3.23%
jan 1, 2004
9.781K
+44.79
0.46%
jan 1, 2005
9.845K
+64.33
0.66%
jan 1, 2006
10.083K
+238.04
2.42%
jan 1, 2007
10.321K
+237.37
2.35%
jan 1, 2008
11.826K
+1.506K
14.59%
jan 1, 2009
12.049K
+222.899
1.88%
jan 1, 2010
12.582K
+532.79
4.42%
jan 1, 2011
13.492K
+910.41
7.24%
jan 1, 2012
14.158K
+665.98
4.94%
jan 1, 2013
14.258K
+99.64
0.7%
jan 1, 2014
14.655K
+396.84
2.78%
jan 1, 2015
15.188K
+533.42
3.64%
Ranking of countries by current statistics by years


Comments: