29
/
en
AIzaSyAYiBZKx7MnpbEhh9jyipgxe19OcubqV5w
April 1, 2024
40708
Late-demographic dividend
LTE
false
2
1
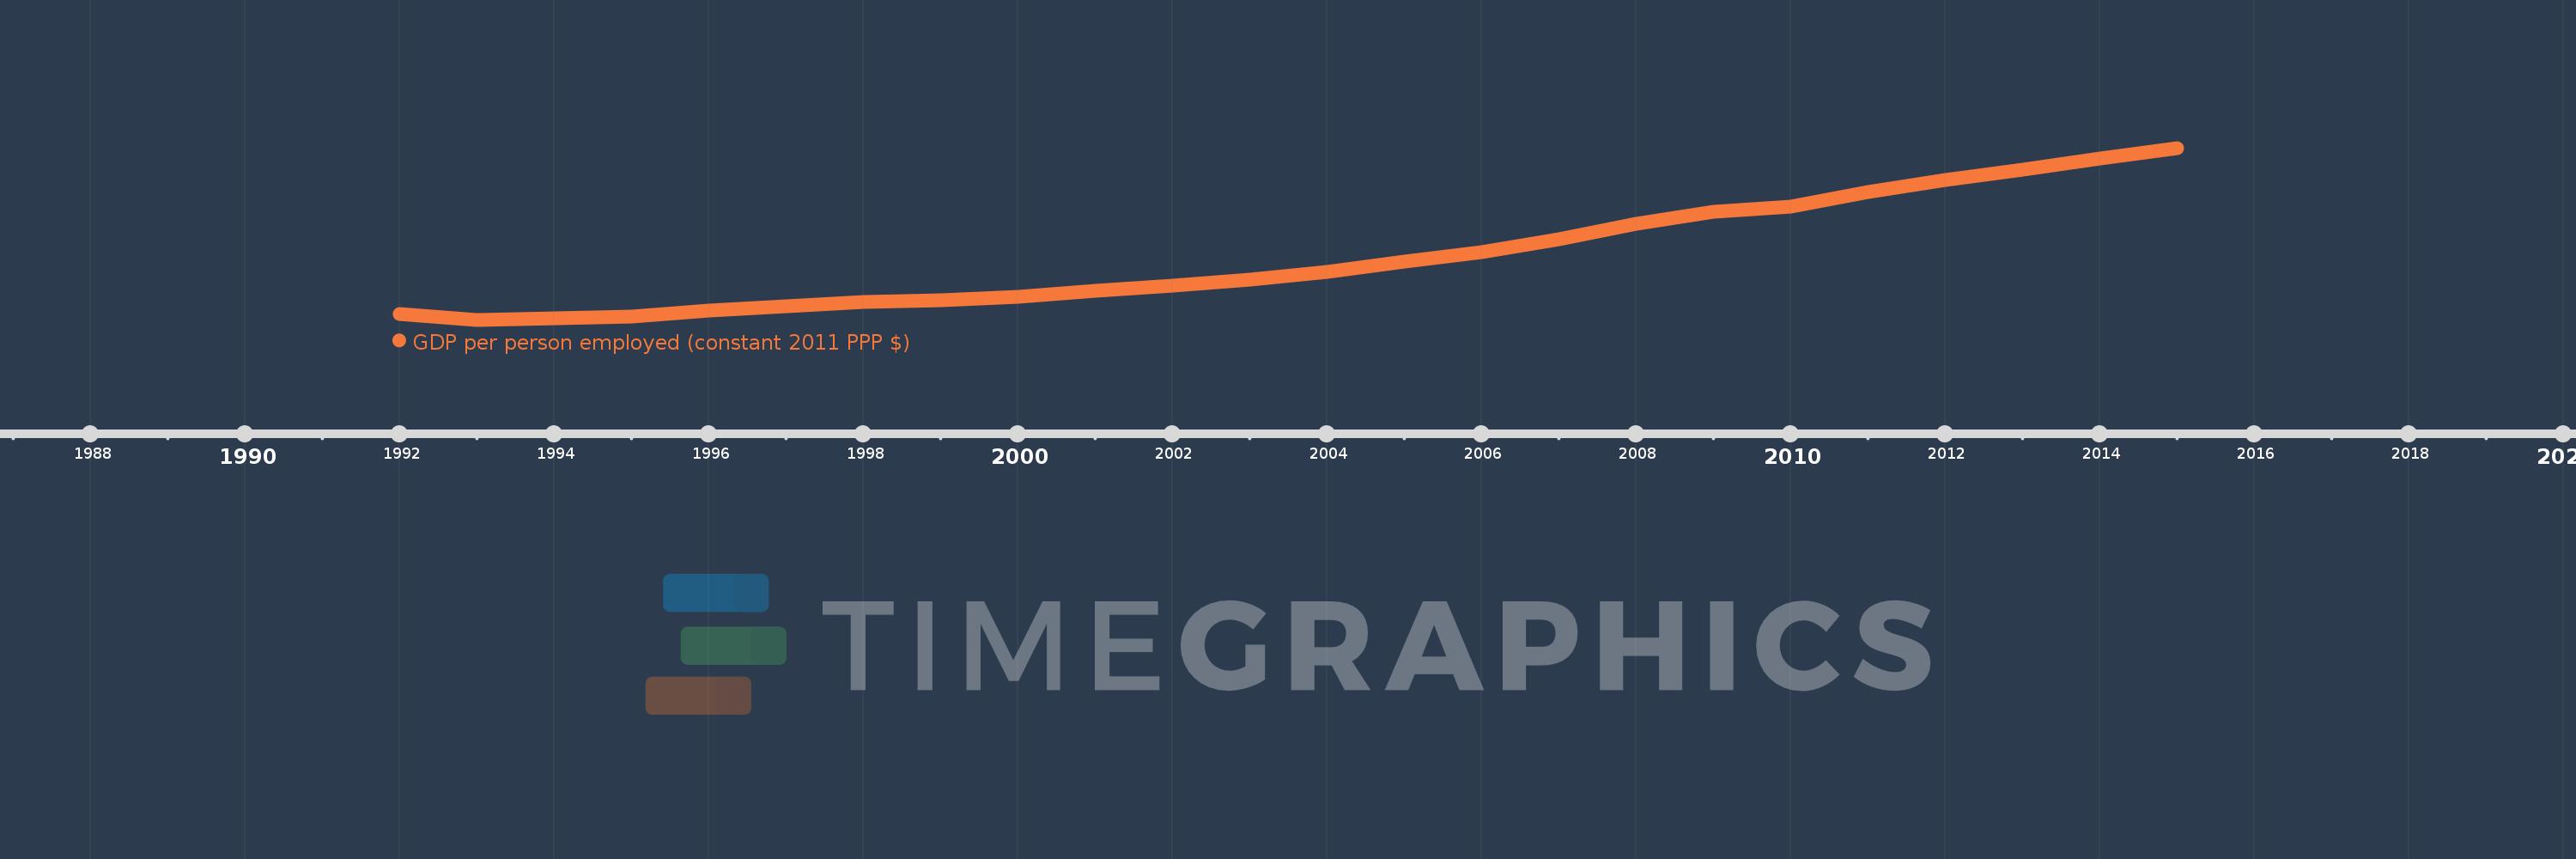
GDP per person employed (constant 2011 PPP $)
2015,2014,2013,2012,2011,2010,2009,2008,2007,2006,2005,2004,2003,2002,2001,2000,1999,1998,1997,1996,1995,1994,1993,1992
This statistics in other country:
AfghanistanAlbaniaAlgeriaAngolaArab WorldArgentinaArmeniaAustraliaAustriaAzerbaijanBahamas, TheBahrainBangladeshBarbadosBelarusBelgiumBelizeBeninBhutanBoliviaBosnia and HerzegovinaBotswanaBrazilBrunei DarussalamBulgariaBurkina FasoBurundiCabo VerdeCambodiaCameroonCanadaCaribbean small statesCentral African RepublicCentral Europe and the BalticsChadChileChinaColombiaComorosCongo, Dem. Rep.Congo, Rep.Costa RicaCote d'IvoireCroatiaCubaCyprusCzech RepublicDenmarkDominican RepublicEarly-demographic dividendEast Asia & PacificEast Asia & Pacific (excluding high income)East Asia & Pacific (IDA & IBRD countries)EcuadorEgypt, Arab Rep.El SalvadorEquatorial GuineaEritreaEstoniaEthiopiaEuro areaEurope & Central AsiaEurope & Central Asia (excluding high income)Europe & Central Asia (IDA & IBRD countries)European UnionFijiFinlandFragile and conflict affected situationsFranceGabonGambia, TheGeorgiaGermanyGhanaGreeceGuatemalaGuineaGuinea-BissauGuyanaHaitiHeavily indebted poor countries (HIPC)High incomeHondurasHong Kong SAR, ChinaHungaryIBRD onlyIcelandIDA & IBRD totalIDA blendIDA onlyIDA totalIndiaIndonesiaIran, Islamic Rep.IraqIrelandIsraelItalyJamaicaJapanJordanKazakhstanKenyaKorea, Dem. People’s Rep.Korea, Rep.KuwaitKyrgyz RepublicLao PDRLate-demographic dividendLatin America & Caribbean Latin America & Caribbean (excluding high income)Latin America & the Caribbean (IDA & IBRD countries)LatviaLeast developed countries: UN classificationLebanonLesothoLiberiaLibyaLithuaniaLow & middle incomeLow incomeLower middle incomeLuxembourgMacao SAR, ChinaMacedonia, FYRMadagascarMalawiMalaysiaMaldivesMaliMaltaMauritaniaMauritiusMexicoMiddle East & North AfricaMiddle East & North Africa (excluding high income)Middle East & North Africa (IDA & IBRD countries)Middle incomeMoldovaMongoliaMontenegroMoroccoMozambiqueMyanmarNamibiaNepalNetherlandsNew ZealandNicaraguaNigerNigeriaNorth AmericaNorwayOECD membersOmanOther small statesPakistanPanamaPapua New GuineaParaguayPeruPhilippinesPolandPortugalPost-demographic dividendPre-demographic dividendPuerto RicoQatarRomaniaRussian FederationRwandaSaudi ArabiaSenegalSerbiaSierra LeoneSingaporeSlovak RepublicSloveniaSmall statesSolomon IslandsSomaliaSouth AfricaSouth AsiaSouth Asia (IDA & IBRD)SpainSri LankaSub-Saharan Africa Sub-Saharan Africa (excluding high income)Sub-Saharan Africa (IDA & IBRD countries)SudanSurinameSwazilandSwedenSwitzerlandSyrian Arab RepublicTajikistanTanzaniaThailandTimor-LesteTogoTrinidad and TobagoTunisiaTurkeyTurkmenistanUgandaUkraineUnited Arab EmiratesUnited KingdomUnited StatesUpper middle incomeUruguayUzbekistanVenezuela, RBVietnamWest Bank and GazaWorldYemen, Rep.ZambiaZimbabwe Timeline:
This timeline shows a graph from 1992 to 2015 of Late-demographic dividend. No data until 1991. Number of actual observations by date: 24.
Source name:
World Development Indicators
Source organization:
International Labour Organization, Key Indicators of the Labour Market database.
Categories, topics:
Social Protection & Labor
Last updated:
apr 23, 2017
Indicators value changes by year
Minimum:
9.497K
jan 1, 1993
Maximum:
25.977K
jan 1, 2015
At the date of observation
Value
Absolute change
Change from previous value
jan 1, 1992
10.02K
+10.02K
0.0%
jan 1, 1993
9.497K
-523.051
-5.22%
jan 1, 1994
9.615K
+117.755
1.24%
jan 1, 1995
9.821K
+206.784
2.15%
jan 1, 1996
10.388K
+567.107
5.77%
jan 1, 1997
10.78K
+392.083
3.77%
jan 1, 1998
11.223K
+442.512
4.1%
jan 1, 1999
11.387K
+163.804
1.46%
jan 1, 2000
11.708K
+321.65
2.82%
jan 1, 2001
12.301K
+592.35
5.06%
jan 1, 2002
12.799K
+498.293
4.05%
jan 1, 2003
13.365K
+566.238
4.42%
jan 1, 2004
14.126K
+760.941
5.69%
jan 1, 2005
15.071K
+945.071
6.69%
jan 1, 2006
15.991K
+919.95
6.1%
jan 1, 2007
17.251K
+1.26K
7.88%
jan 1, 2008
18.715K
+1.463K
8.48%
jan 1, 2009
19.869K
+1.154K
6.17%
jan 1, 2010
20.356K
+487.055
2.45%
jan 1, 2011
21.742K
+1.386K
6.81%
jan 1, 2012
22.877K
+1.135K
5.22%
jan 1, 2013
23.869K
+992.358
4.34%
jan 1, 2014
24.939K
+1.07K
4.48%
jan 1, 2015
25.977K
+1.038K
4.16%
Ranking of countries by current statistics by years


Comments: