Download This statistics in other country:
Timeline:
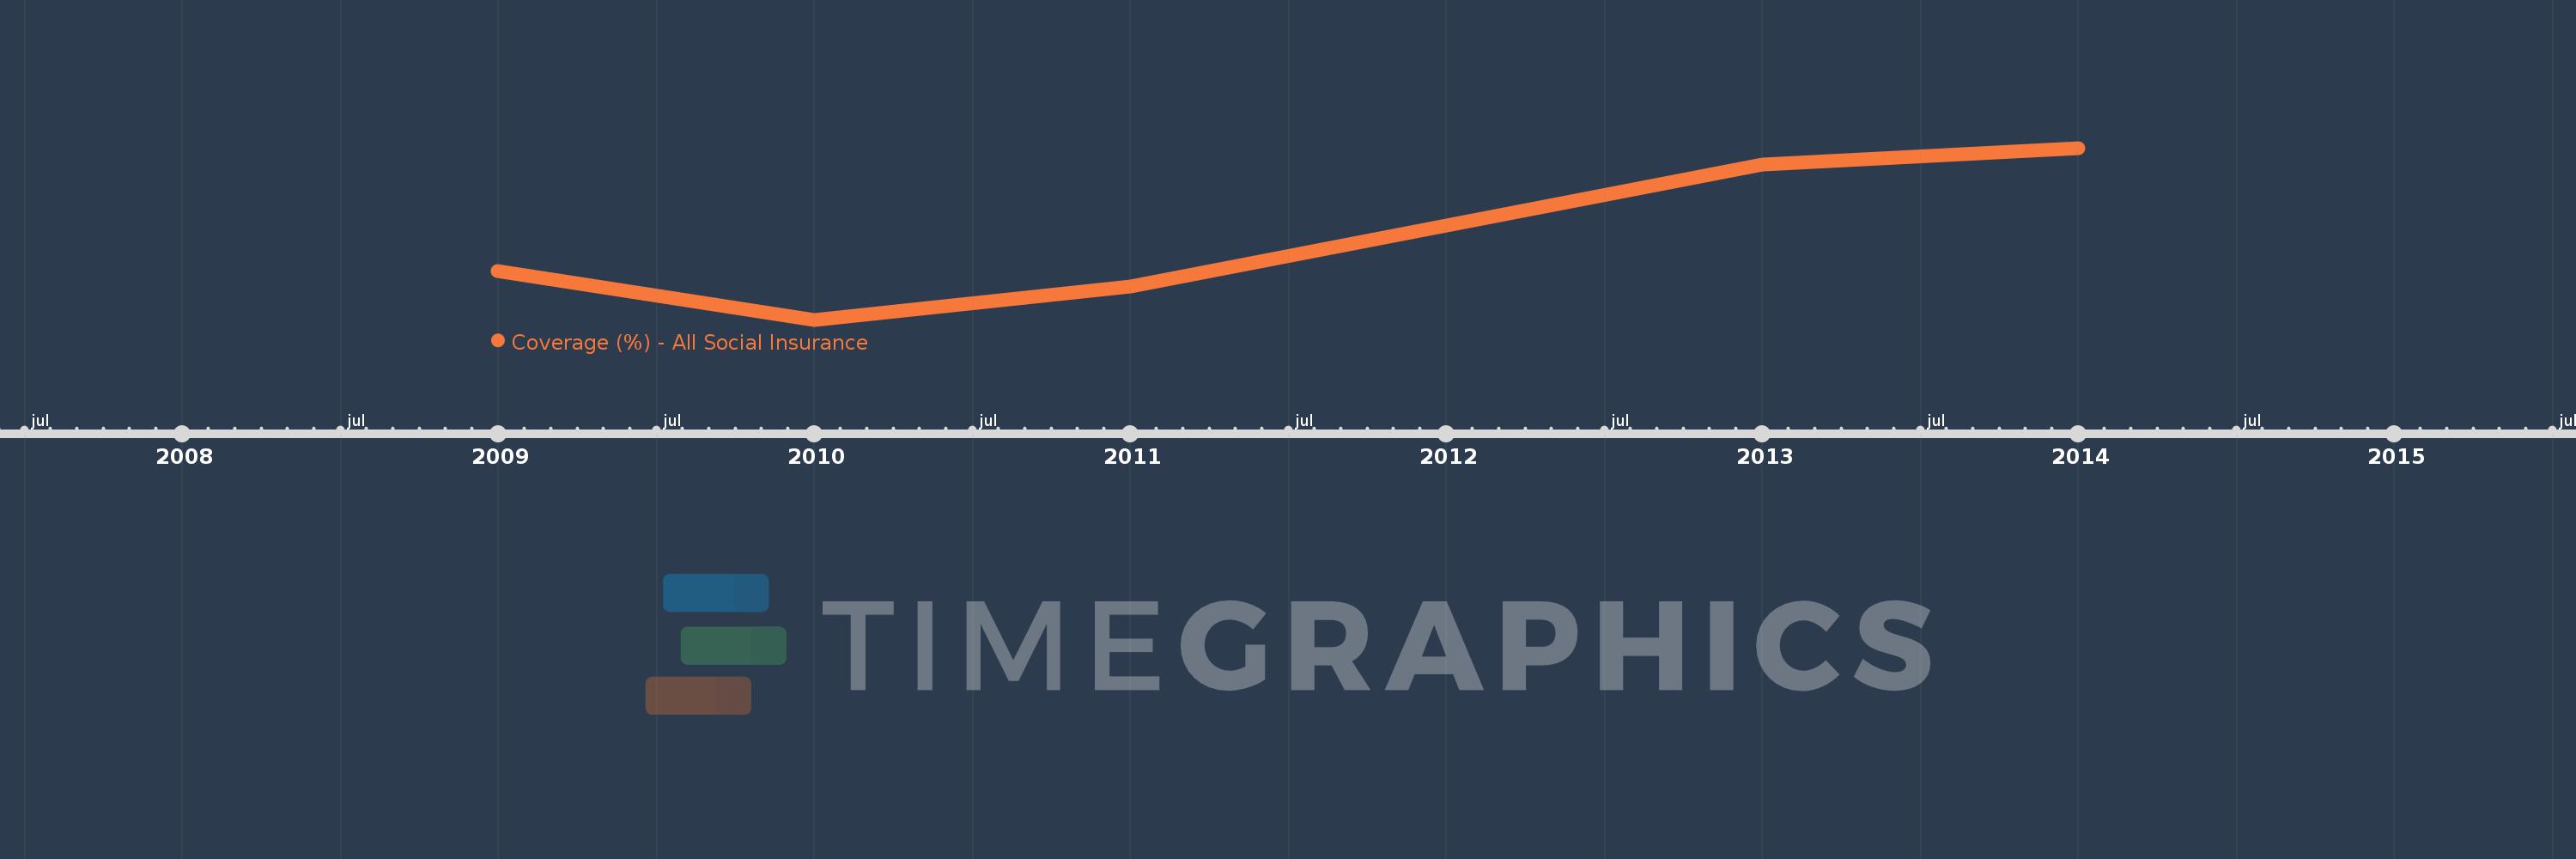
This timeline shows a graph from 2009 to 2014 of Belarus. No data until 2008. Number of actual observations by date: 5.
Source name:
World Development Indicators
Source organization:
The Atlas of Social Protection: Indicators of Resilience and Equity (ASPIRE)
Categories, topics:
Social Protection & Labor
Last updated:
apr 23, 2017
Indicators value changes by year
Minimum:
40.885
jan 1, 2010
Maximum:
48.687
jan 1, 2014
At the date of observation
Value
Absolute change
Change from the previous value
jan 1, 2009
43.085
+43.085
0.0%
jan 1, 2010
40.885
-2.2
-5.11%
jan 1, 2011
42.39
+1.504
3.68%
jan 1, 2013
47.925
+5.536
13.06%
jan 1, 2014
48.687
+0.762
1.59%
Ranking of countries by current statistics by years
