This statistics in other country:
Timeline:
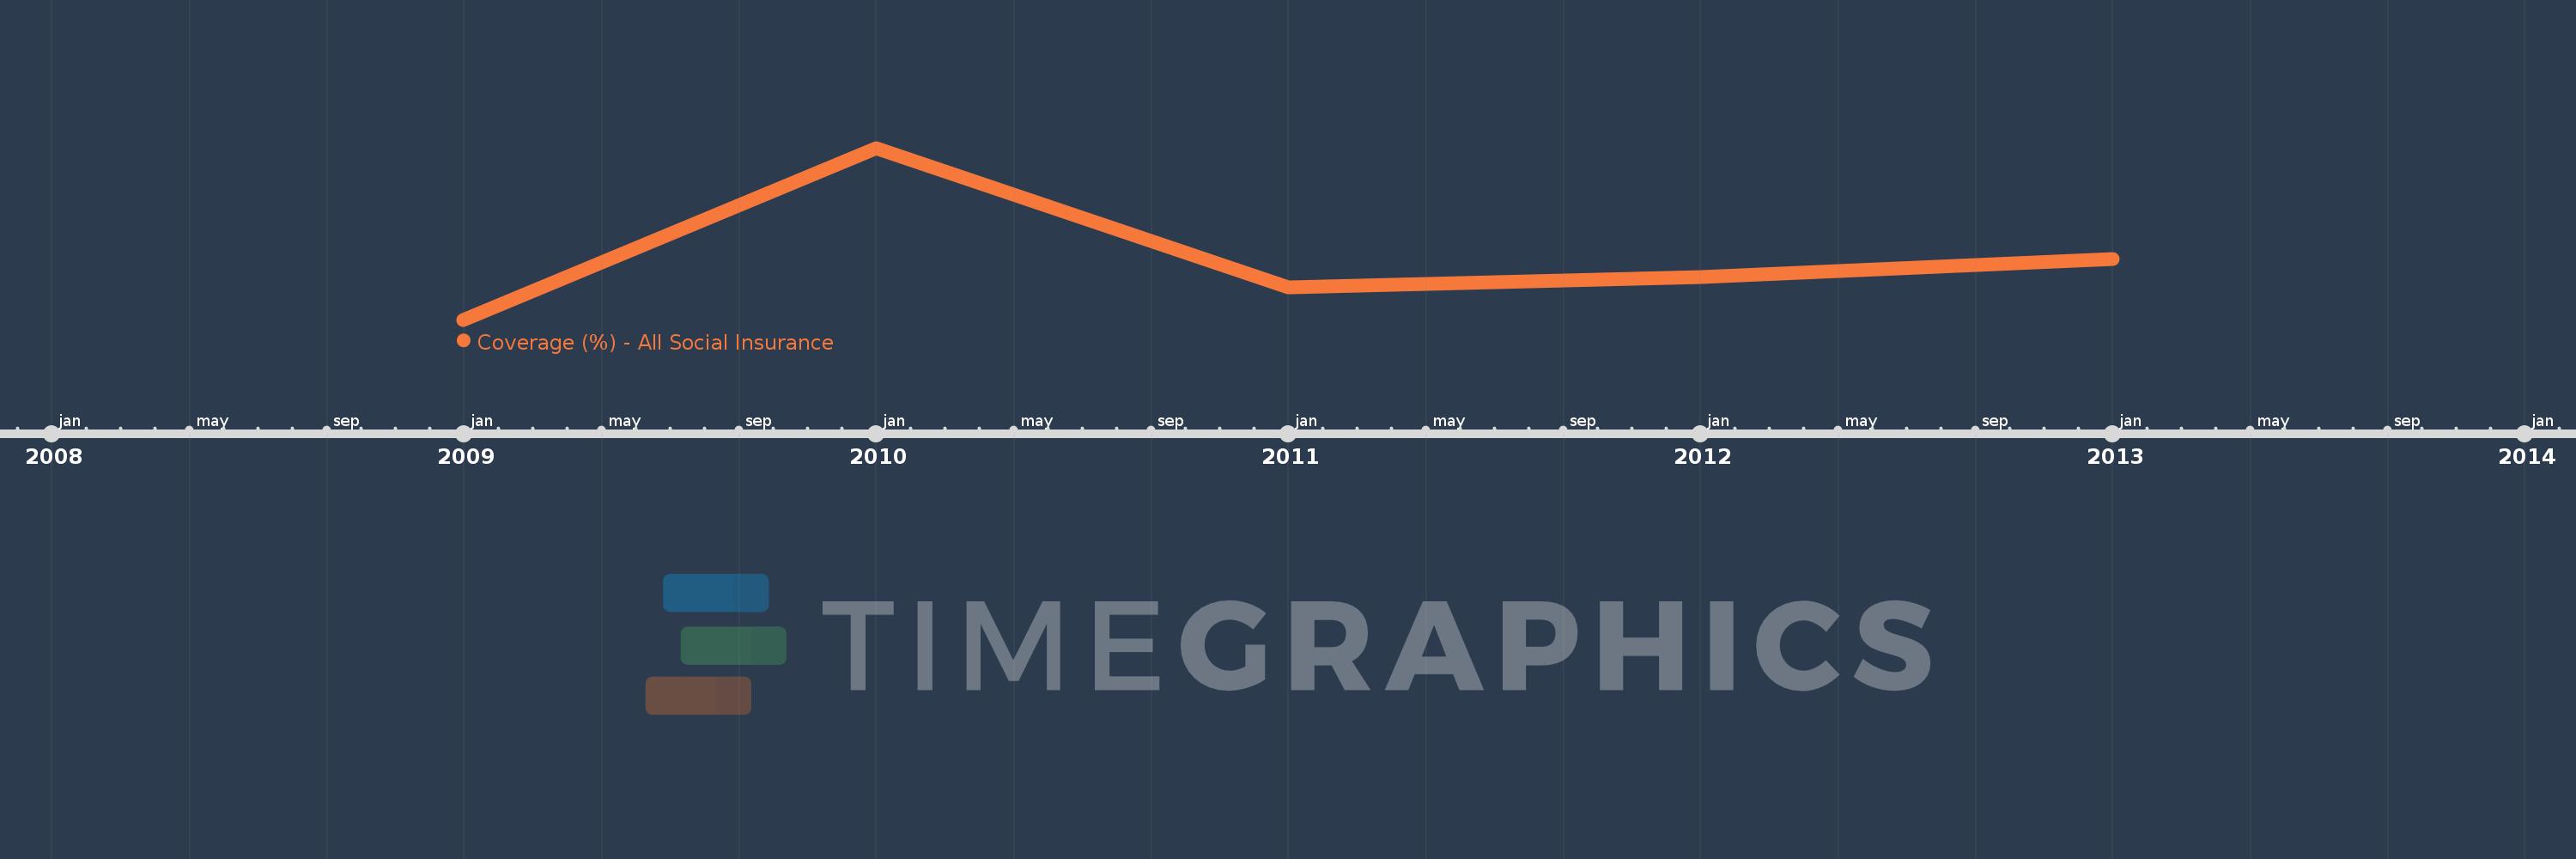
This timeline shows a graph from 2009 to 2013 of Costa Rica. No data until 2008. Number of actual observations by date: 5.
Source name:
World Development Indicators
Source organization:
The Atlas of Social Protection: Indicators of Resilience and Equity (ASPIRE)
Categories, topics:
Social Protection & Labor
Last updated:
apr 23, 2017
Indicators value changes by year
Minimum:
12.945
jan 1, 2009
Maximum:
18.836
jan 1, 2010
At the date of observation
Value
Absolute change
Change from previous value
jan 1, 2009
12.945
+12.945
0.0%
jan 1, 2010
18.836
+5.891
45.51%
jan 1, 2011
14.052
-4.784
-25.4%
jan 1, 2012
14.403
+0.352
2.5%
jan 1, 2013
15.028
+0.625
4.34%
Ranking of countries by current statistics by years


Comments: