30
/
AIzaSyAYiBZKx7MnpbEhh9jyipgxe19OcubqV5w
April 1, 2024
79613
Barbados
BRB
true
2
1
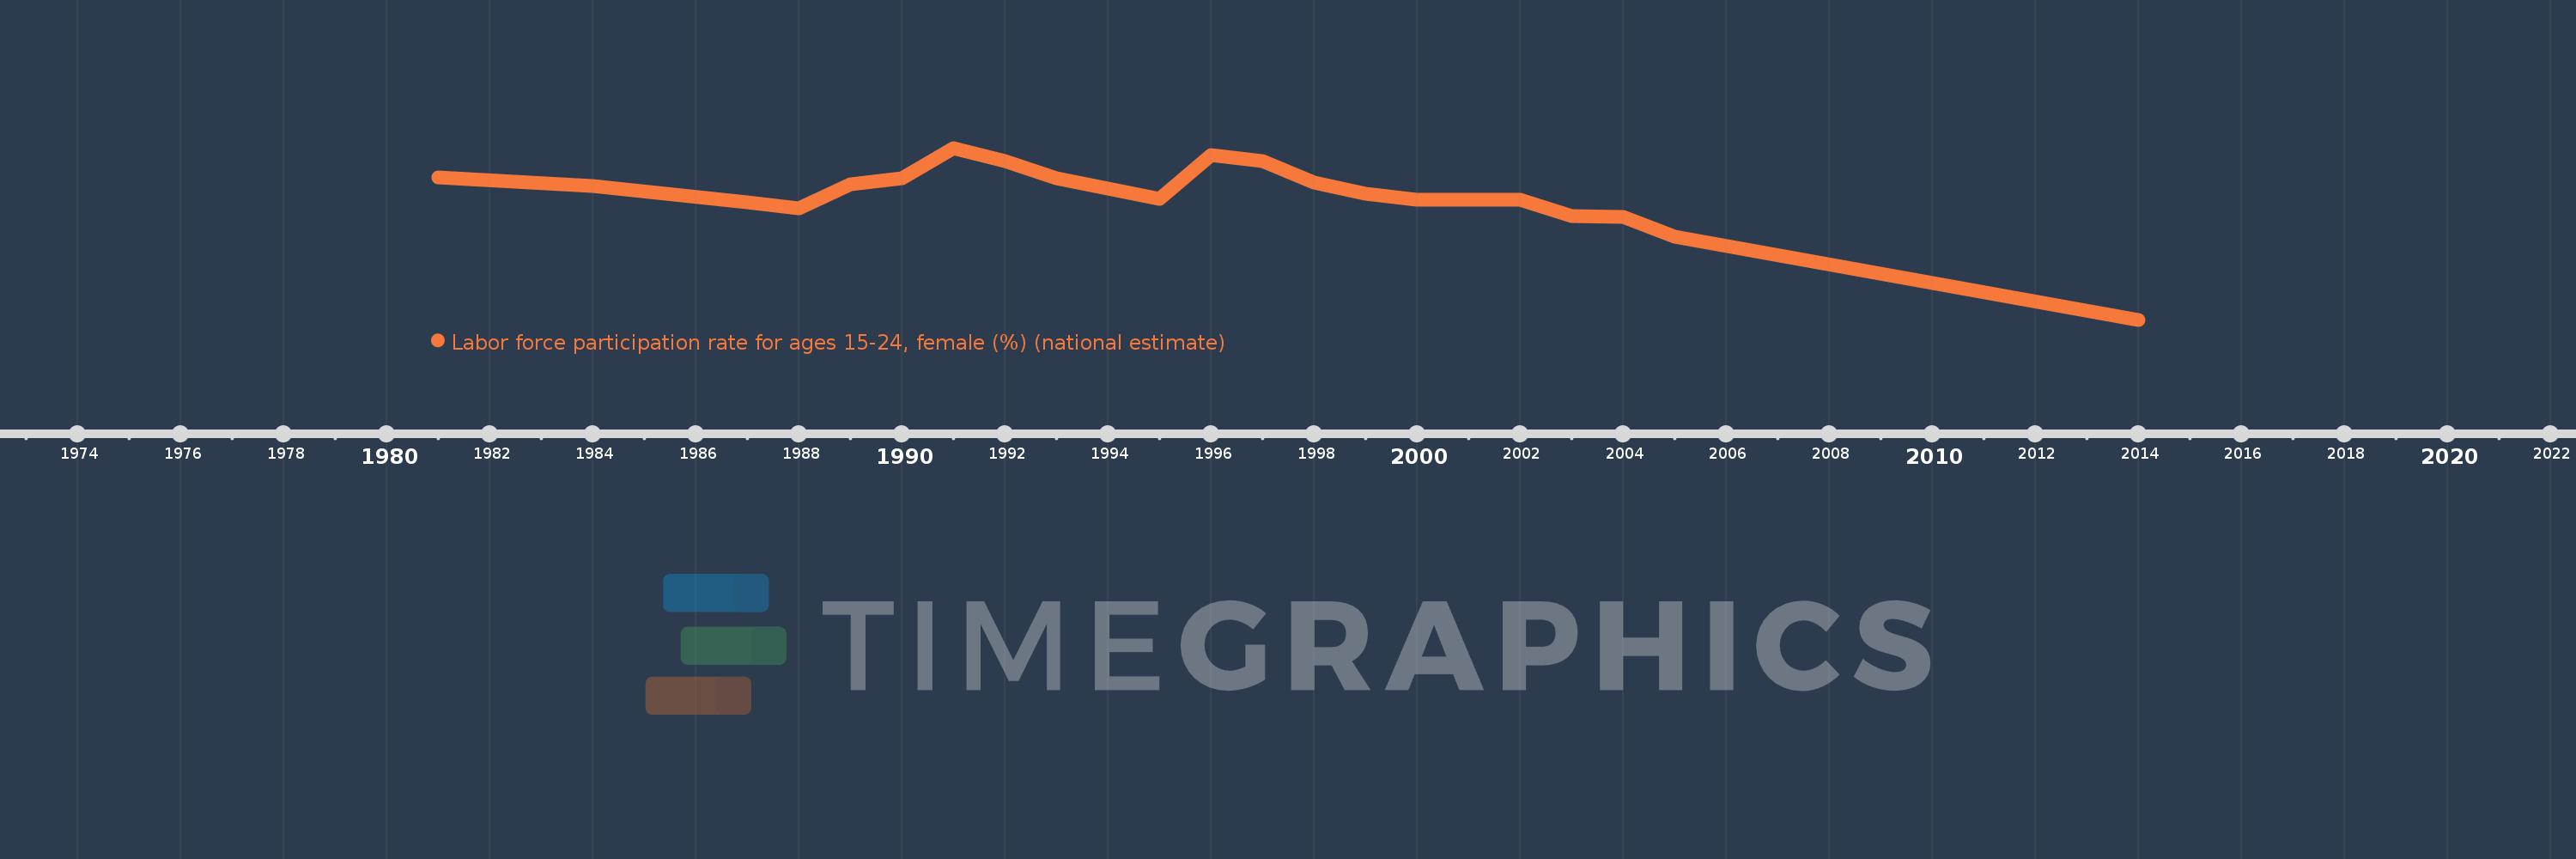
Labor force participation rate for ages 15-24, female (%) (national estimate)
2014,2005,2004,2003,2002,2000,1999,1998,1997,1996,1995,1993,1992,1991,1990,1989,1988,1987,1984,1981
