29
/
en
AIzaSyAYiBZKx7MnpbEhh9jyipgxe19OcubqV5w
April 1, 2024
52737
OECD members
OED
false
2
1
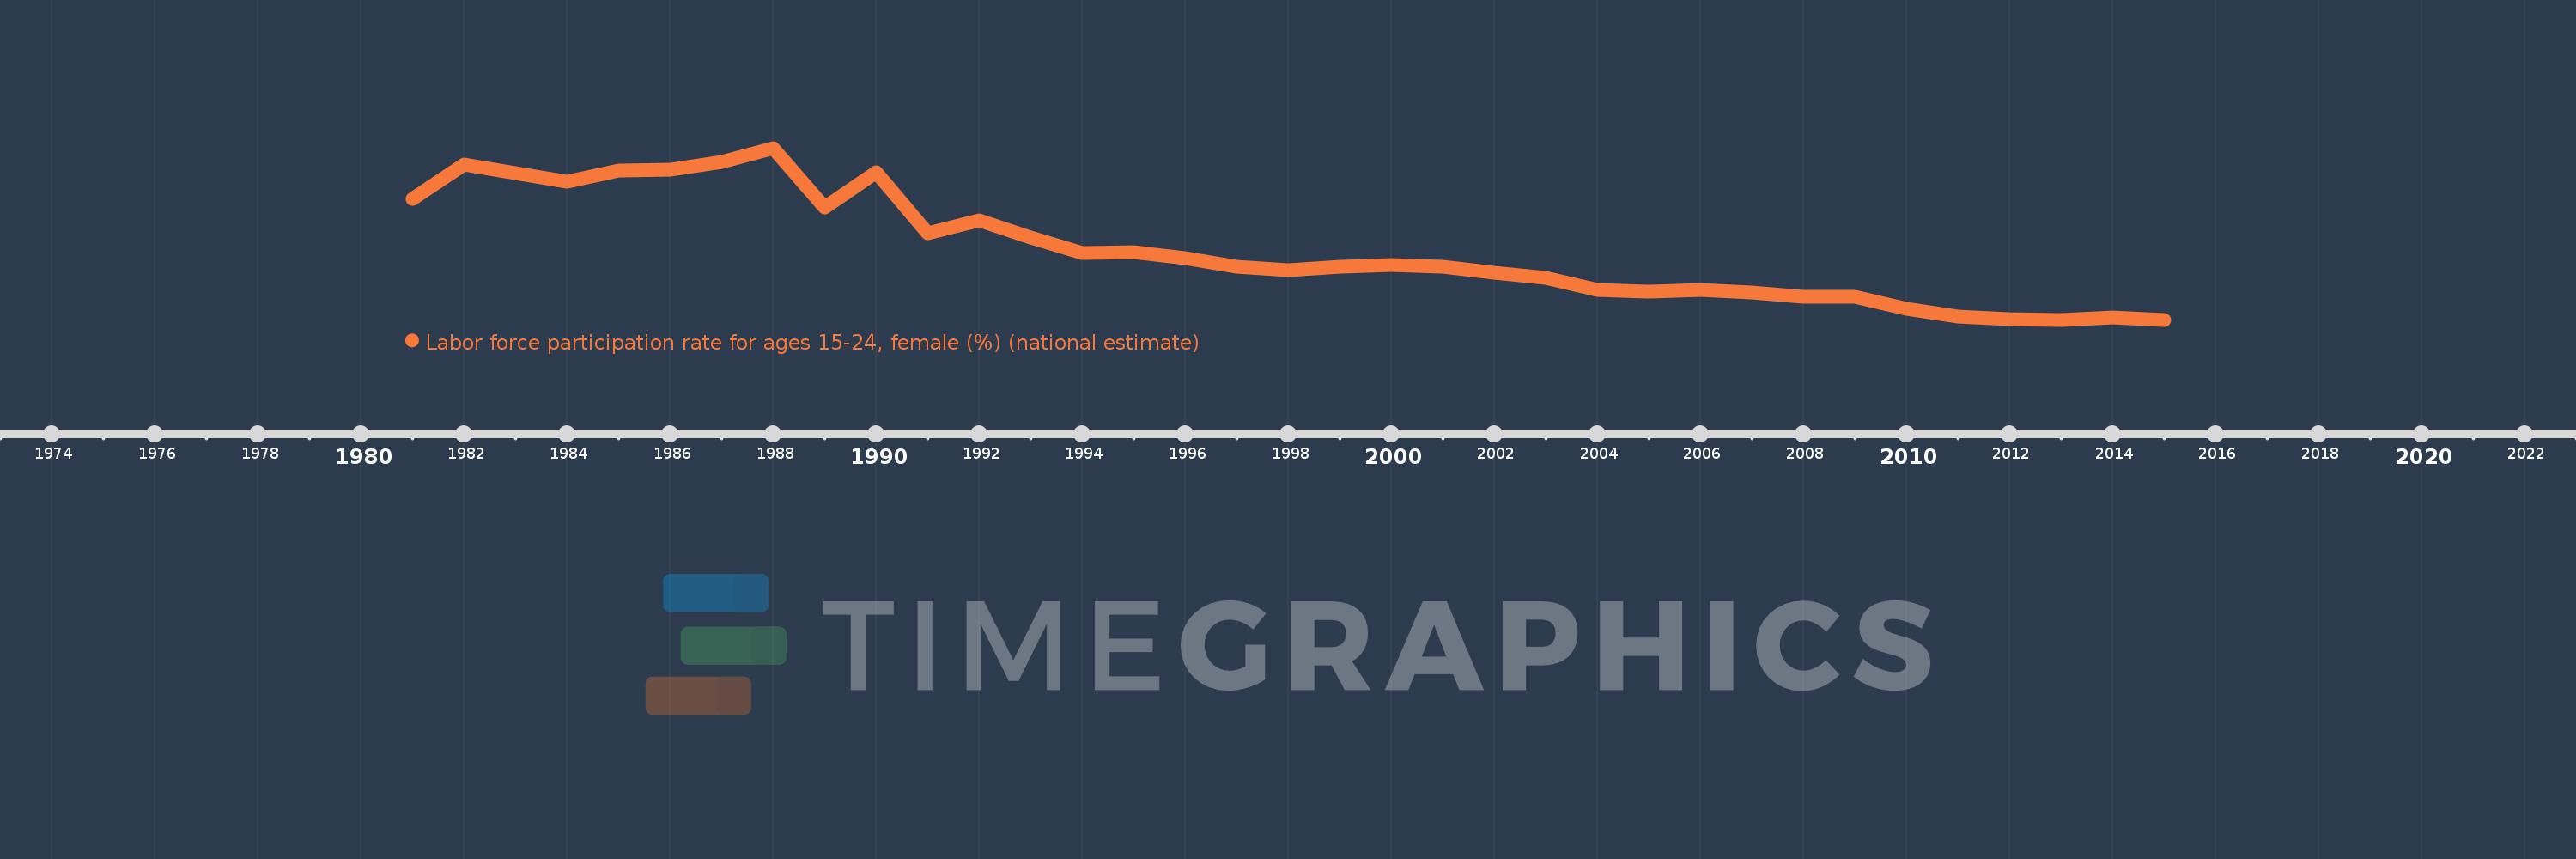
Labor force participation rate for ages 15-24, female (%) (national estimate)
2015,2014,2013,2012,2011,2010,2009,2008,2007,2006,2005,2004,2003,2002,2001,2000,1999,1998,1997,1996,1995,1994,1993,1992,1991,1990,1989,1988,1987,1986,1985,1984,1982,1981
This statistics in other country:
AlbaniaAlgeriaAmerican SamoaAntigua and BarbudaArgentinaArmeniaArubaAustraliaAustriaAzerbaijanBahamas, TheBahrainBangladeshBarbadosBelarusBelgiumBelizeBeninBermudaBhutanBoliviaBosnia and HerzegovinaBotswanaBrazilBritish Virgin IslandsBrunei DarussalamBulgariaBurkina FasoBurundiCabo VerdeCambodiaCameroonCanadaCaribbean small statesCayman IslandsCentral African RepublicCentral Europe and the BalticsChadChileColombiaComorosCongo, Dem. Rep.Congo, Rep.Costa RicaCote d'IvoireCroatiaCubaCyprusCzech RepublicDenmarkDjiboutiDominicaDominican RepublicEarly-demographic dividendEcuadorEgypt, Arab Rep.El SalvadorEquatorial GuineaEstoniaEthiopiaEuro areaEurope & Central AsiaEurope & Central Asia (excluding high income)Europe & Central Asia (IDA & IBRD countries)European UnionFijiFinlandFranceFrench PolynesiaGabonGambia, TheGeorgiaGermanyGhanaGibraltarGreeceGrenadaGuamGuatemalaGuineaGuyanaHaitiHigh incomeHondurasHong Kong SAR, ChinaHungaryIcelandIDA blendIndiaIndonesiaIran, Islamic Rep.IraqIrelandIsle of ManIsraelItalyJamaicaJapanJordanKazakhstanKenyaKiribatiKorea, Rep.KosovoKuwaitKyrgyz RepublicLao PDRLatin America & Caribbean Latin America & Caribbean (excluding high income)Latin America & the Caribbean (IDA & IBRD countries)LatviaLebanonLesothoLiberiaLibyaLiechtensteinLithuaniaLower middle incomeLuxembourgMacao SAR, ChinaMacedonia, FYRMadagascarMalawiMalaysiaMaldivesMaliMaltaMauritiusMexicoMiddle East & North AfricaMiddle East & North Africa (excluding high income)Middle East & North Africa (IDA & IBRD countries)MoldovaMonacoMongoliaMontenegroMoroccoMozambiqueMyanmarNamibiaNauruNepalNetherlandsNew ZealandNicaraguaNigerNigeriaNorth AmericaNorthern Mariana IslandsNorwayOECD membersOmanPakistanPalauPanamaPapua New GuineaParaguayPeruPhilippinesPolandPortugalPost-demographic dividendPuerto RicoQatarRomaniaRussian FederationRwandaSamoaSan MarinoSao Tome and PrincipeSaudi ArabiaSenegalSerbiaSeychellesSierra LeoneSingaporeSlovak RepublicSloveniaSolomon IslandsSouth AfricaSouth AsiaSouth Asia (IDA & IBRD)South SudanSpainSri LankaSt. Kitts and NevisSt. LuciaSt. Vincent and the GrenadinesSudanSurinameSwazilandSwedenSwitzerlandSyrian Arab RepublicTajikistanTanzaniaThailandTimor-LesteTogoTongaTrinidad and TobagoTunisiaTurkeyTurks and Caicos IslandsUgandaUkraineUnited Arab EmiratesUnited KingdomUnited StatesUruguayVanuatuVenezuela, RBVietnamVirgin Islands (U.S.)West Bank and GazaYemen, Rep.ZambiaZimbabwe Timeline:
This timeline shows a graph from 1981 to 2015 of OECD members. No data until 1980. Number of actual observations by date: 34.
Source name:
World Development Indicators
Source organization:
International Labour Organization, Key Indicators of the Labour Market database.
Categories, topics:
Social Protection & Labor
Last updated:
apr 23, 2017
Indicators value changes by year
Minimum:
42.846
jan 1, 2015
Maximum:
54.781
jan 1, 1988
At the date of observation
Value
Absolute change
Change from previous value
jan 1, 1981
51.272
+51.272
0.0%
jan 1, 1982
53.643
+2.371
4.62%
jan 1, 1984
52.453
-1.19
-2.22%
jan 1, 1985
53.191
+0.738
1.41%
jan 1, 1986
53.244
+0.053
0.1%
jan 1, 1987
53.834
+0.59
1.11%
jan 1, 1988
54.781
+0.947
1.76%
jan 1, 1989
50.665
-4.116
-7.51%
jan 1, 1990
53.102
+2.437
4.81%
jan 1, 1991
48.847
-4.255
-8.01%
jan 1, 1992
49.761
+0.913
1.87%
jan 1, 1993
48.532
-1.229
-2.47%
jan 1, 1994
47.469
-1.063
-2.19%
jan 1, 1995
47.515
+0.046
0.1%
jan 1, 1996
47.109
-0.406
-0.86%
jan 1, 1997
46.545
-0.564
-1.2%
jan 1, 1998
46.291
-0.254
-0.55%
jan 1, 1999
46.518
+0.228
0.49%
jan 1, 2000
46.631
+0.113
0.24%
jan 1, 2001
46.544
-0.087
-0.19%
jan 1, 2002
46.106
-0.438
-0.94%
jan 1, 2003
45.752
-0.355
-0.77%
jan 1, 2004
44.92
-0.832
-1.82%
jan 1, 2005
44.784
-0.135
-0.3%
jan 1, 2006
44.914
+0.129
0.29%
jan 1, 2007
44.756
-0.157
-0.35%
jan 1, 2008
44.461
-0.296
-0.66%
jan 1, 2009
44.441
-0.02
-0.04%
jan 1, 2010
43.615
-0.826
-1.86%
jan 1, 2011
43.048
-0.567
-1.3%
jan 1, 2012
42.911
-0.137
-0.32%
jan 1, 2013
42.851
-0.06
-0.14%
jan 1, 2014
43.013
+0.162
0.38%
jan 1, 2015
42.846
-0.167
-0.39%
Ranking of countries by current statistics by years


Comments: