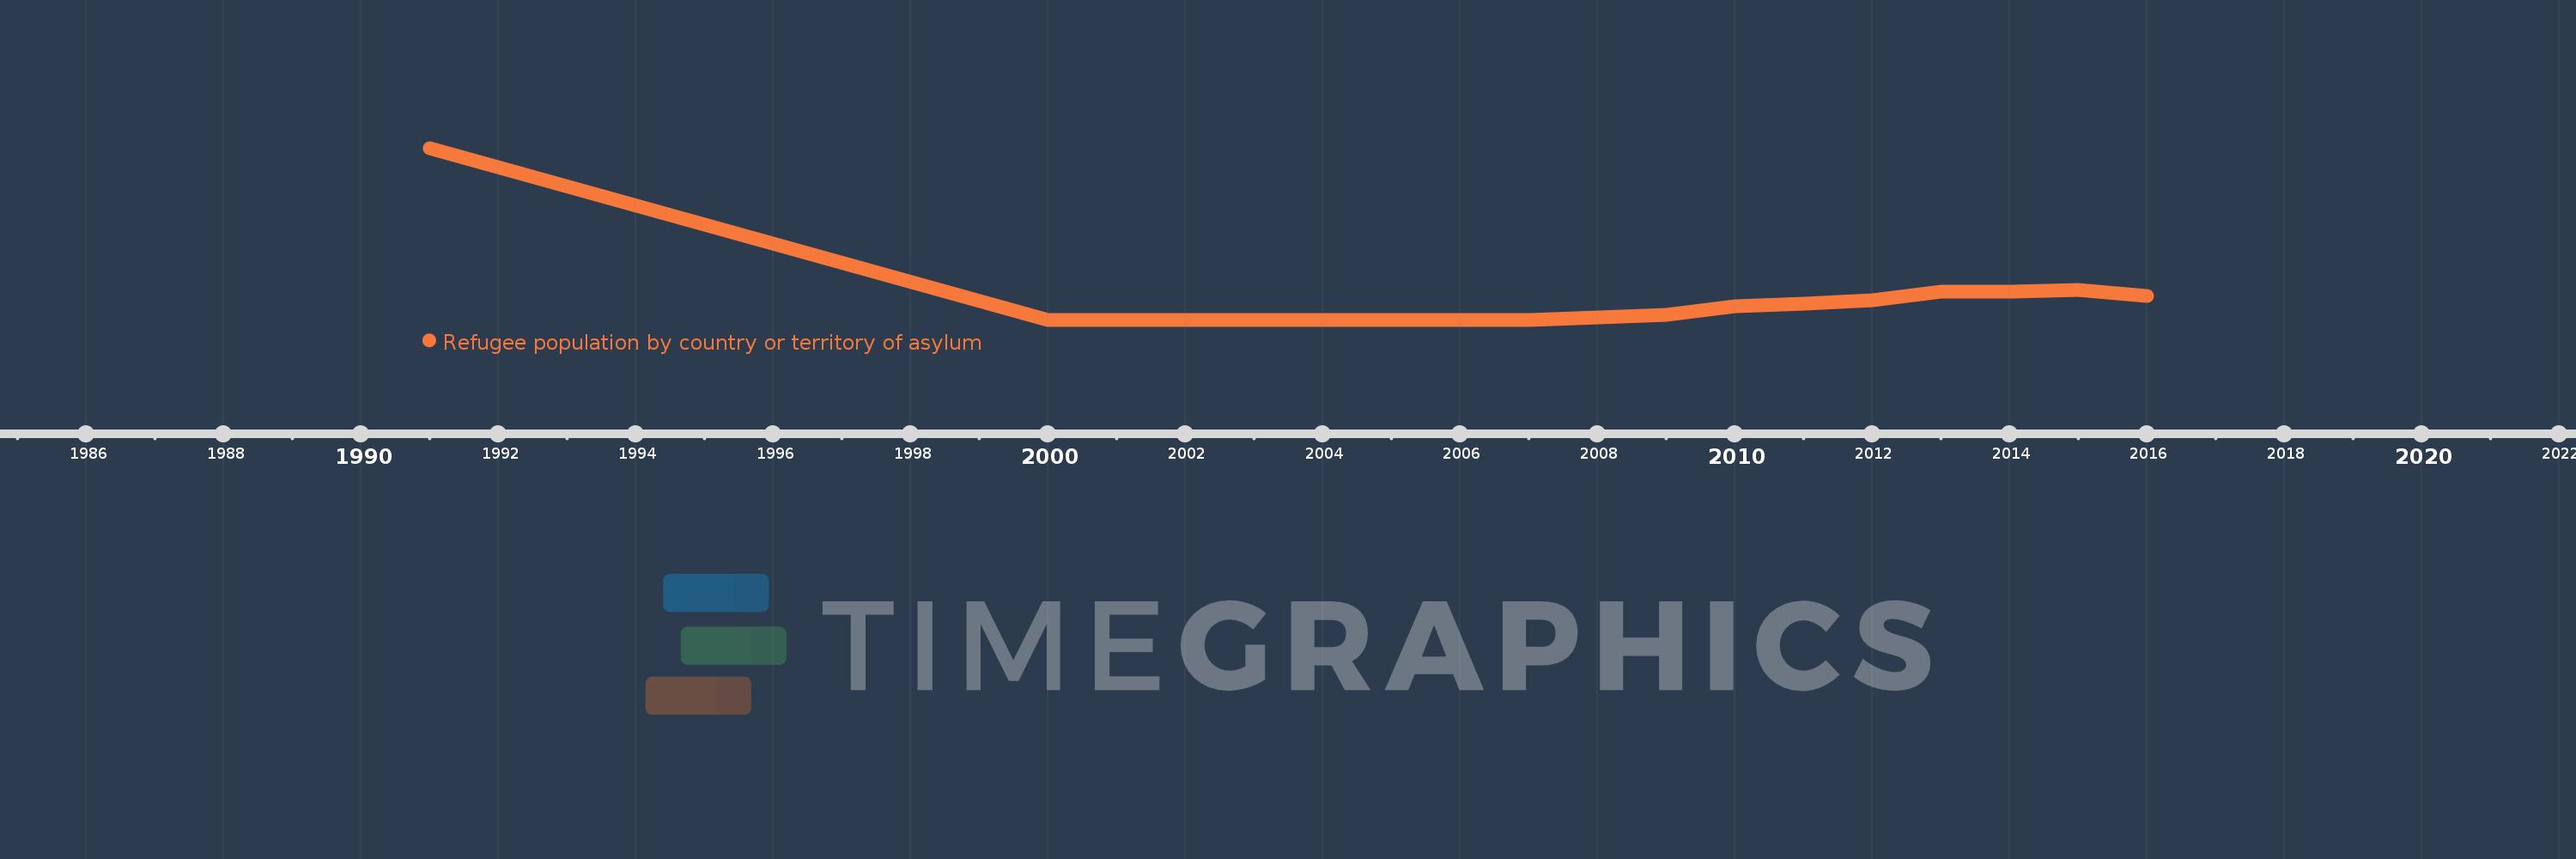
This timeline shows a graph from 1991 to 2016 of Bahrain. No data until 1990. Number of actual observations by date: 13.
Source name:
World Development Indicators
Source organization:
United Nations High Commissioner for Refugees (UNHCR), Statistical Yearbook and data files, complemented by statistics on Palestinian refugees under the mandate of the UNRWA as published on its website. Data from UNHCR are available online at: www.unhcr.org/statistics/populationdatabase.
Categories, topics:
Health, Social Development
Last updated:
apr 23, 2017
Indicators value changes by year
Meaning:
267.385
Minimum:
1.0
jan 1, 2000
Maximum:
1.78K
jan 1, 1991
At the date of observation
Value
Absolute change
Change from the previous value
jan 1, 1991
1.78K
+1.78K
0.0%
jan 1, 2000
1.0
-1.779K
-99.94%
jan 1, 2001
1.0
0.0
0.0%
jan 1, 2002
1.0
0.0
0.0%
jan 1, 2007
1.0
0.0
0.0%
jan 1, 2009
48.0
+47.0
4.7K%
jan 1, 2010
139.0
+91.0
189.58%
jan 1, 2011
165.0
+26.0
18.71%
jan 1, 2012
199.0
+34.0
20.61%
jan 1, 2013
289.0
+90.0
45.23%
jan 1, 2014
294.0
+5.0
1.73%
jan 1, 2015
311.0
+17.0
5.78%
jan 1, 2016
247.0
-64.0
-20.58%
Ranking of countries by current statistics by years
