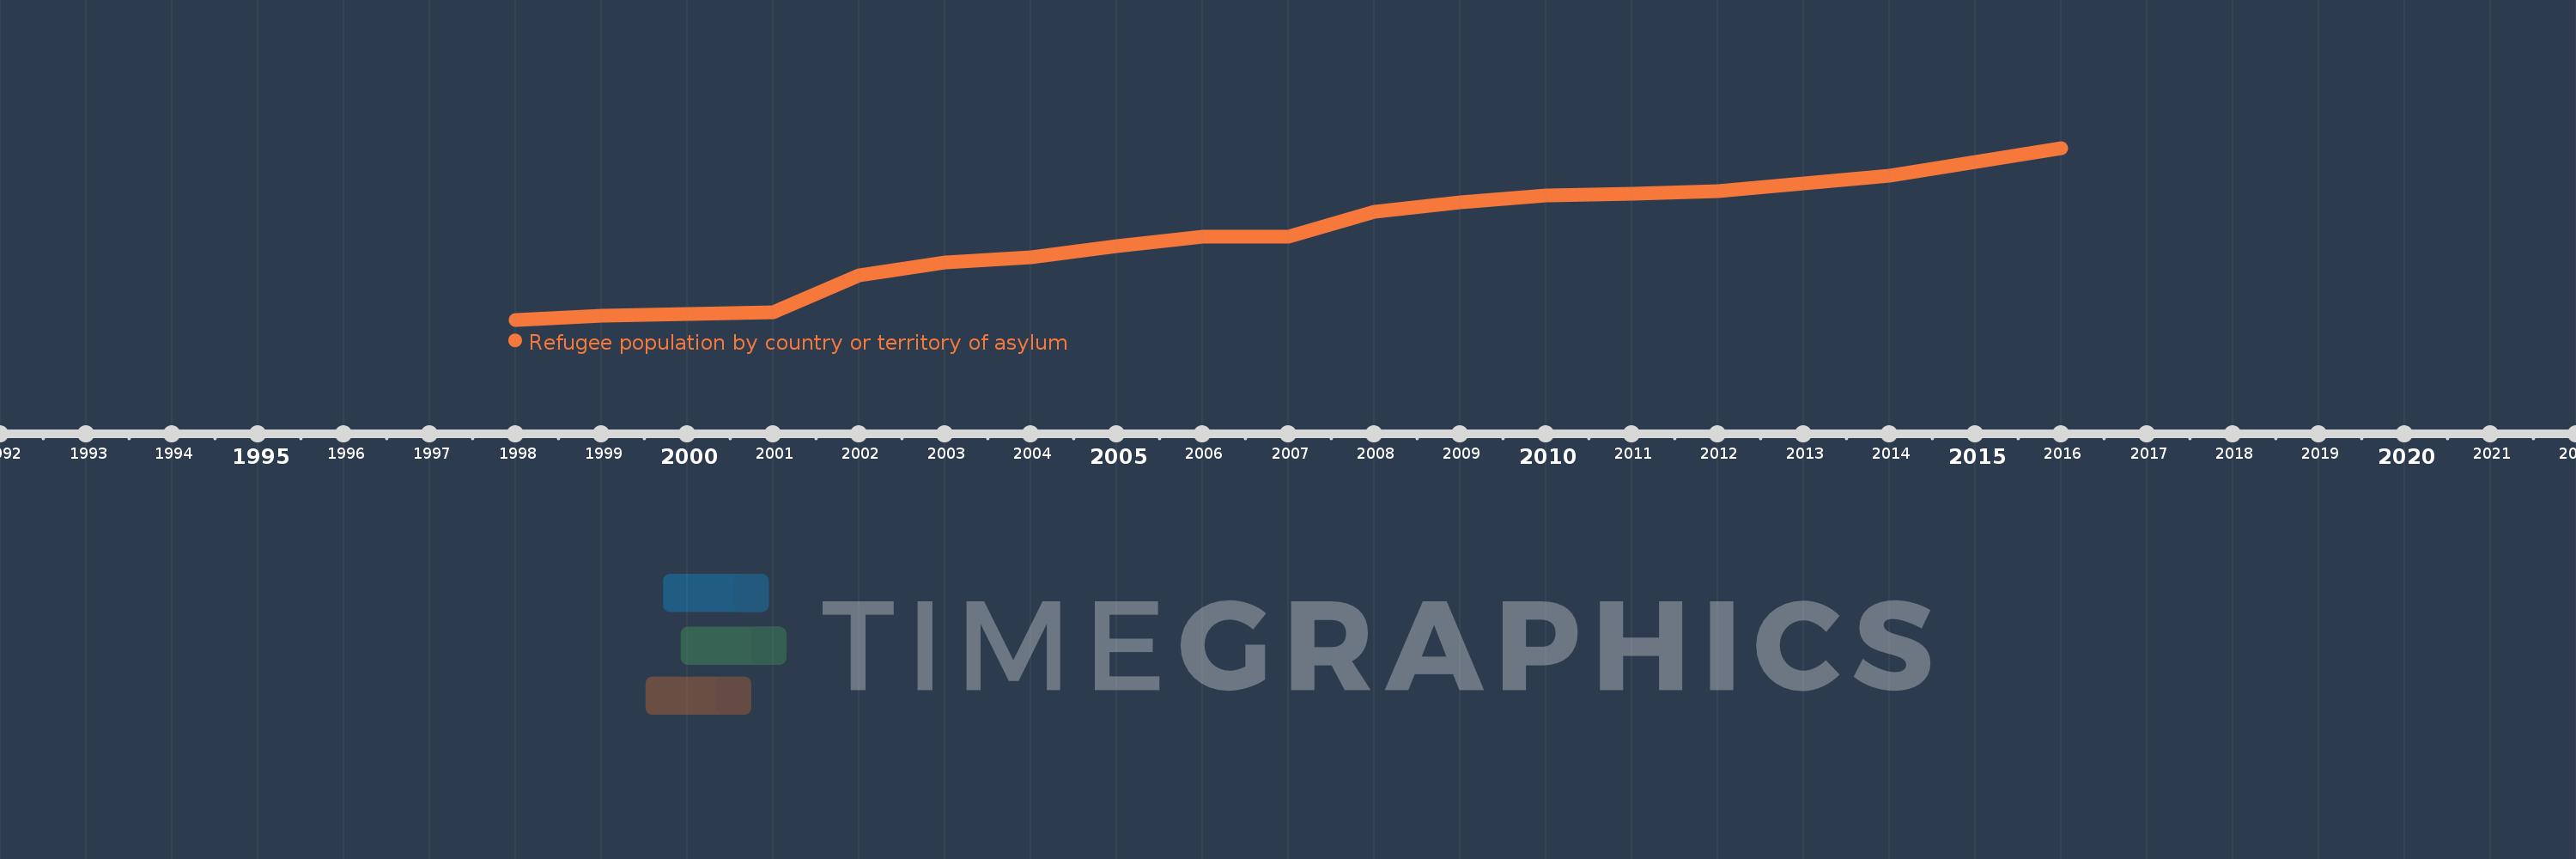
This timeline shows a graph from 1998 to 2016 of Lithuania. No data until 1997. Number of actual observations by date: 19.
Source name:
World Development Indicators
Source organization:
United Nations High Commissioner for Refugees (UNHCR), Statistical Yearbook and data files, complemented by statistics on Palestinian refugees under the mandate of the UNRWA as published on its website. Data from UNHCR are available online at: www.unhcr.org/statistics/populationdatabase.
Categories, topics:
Health, Social Development
Last updated:
apr 23, 2017
Indicators value changes by year
Meaning:
551.158
Minimum:
6.0
jan 1, 1998
Maximum:
1.093K
jan 1, 2016
At the date of observation
Value
Absolute change
Change from the previous value
jan 1, 1998
6.0
+6.0
0.0%
jan 1, 1999
34.0
+28.0
466.67%
jan 1, 2000
44.0
+10.0
29.41%
jan 1, 2001
55.0
+11.0
25.0%
jan 1, 2002
287.0
+232.0
421.82%
jan 1, 2003
368.0
+81.0
28.22%
jan 1, 2004
403.0
+35.0
9.51%
jan 1, 2005
470.0
+67.0
16.63%
jan 1, 2006
531.0
+61.0
12.98%
jan 1, 2007
531.0
0.0
0.0%
jan 1, 2008
688.0
+157.0
29.57%
jan 1, 2009
751.0
+63.0
9.16%
jan 1, 2010
793.0
+42.0
5.59%
jan 1, 2011
803.0
+10.0
1.26%
jan 1, 2012
821.0
+18.0
2.24%
jan 1, 2013
871.0
+50.0
6.09%
jan 1, 2014
916.0
+45.0
5.17%
jan 1, 2015
1.007K
+91.0
9.93%
jan 1, 2016
1.093K
+86.0
8.54%
Ranking of countries by current statistics by years
