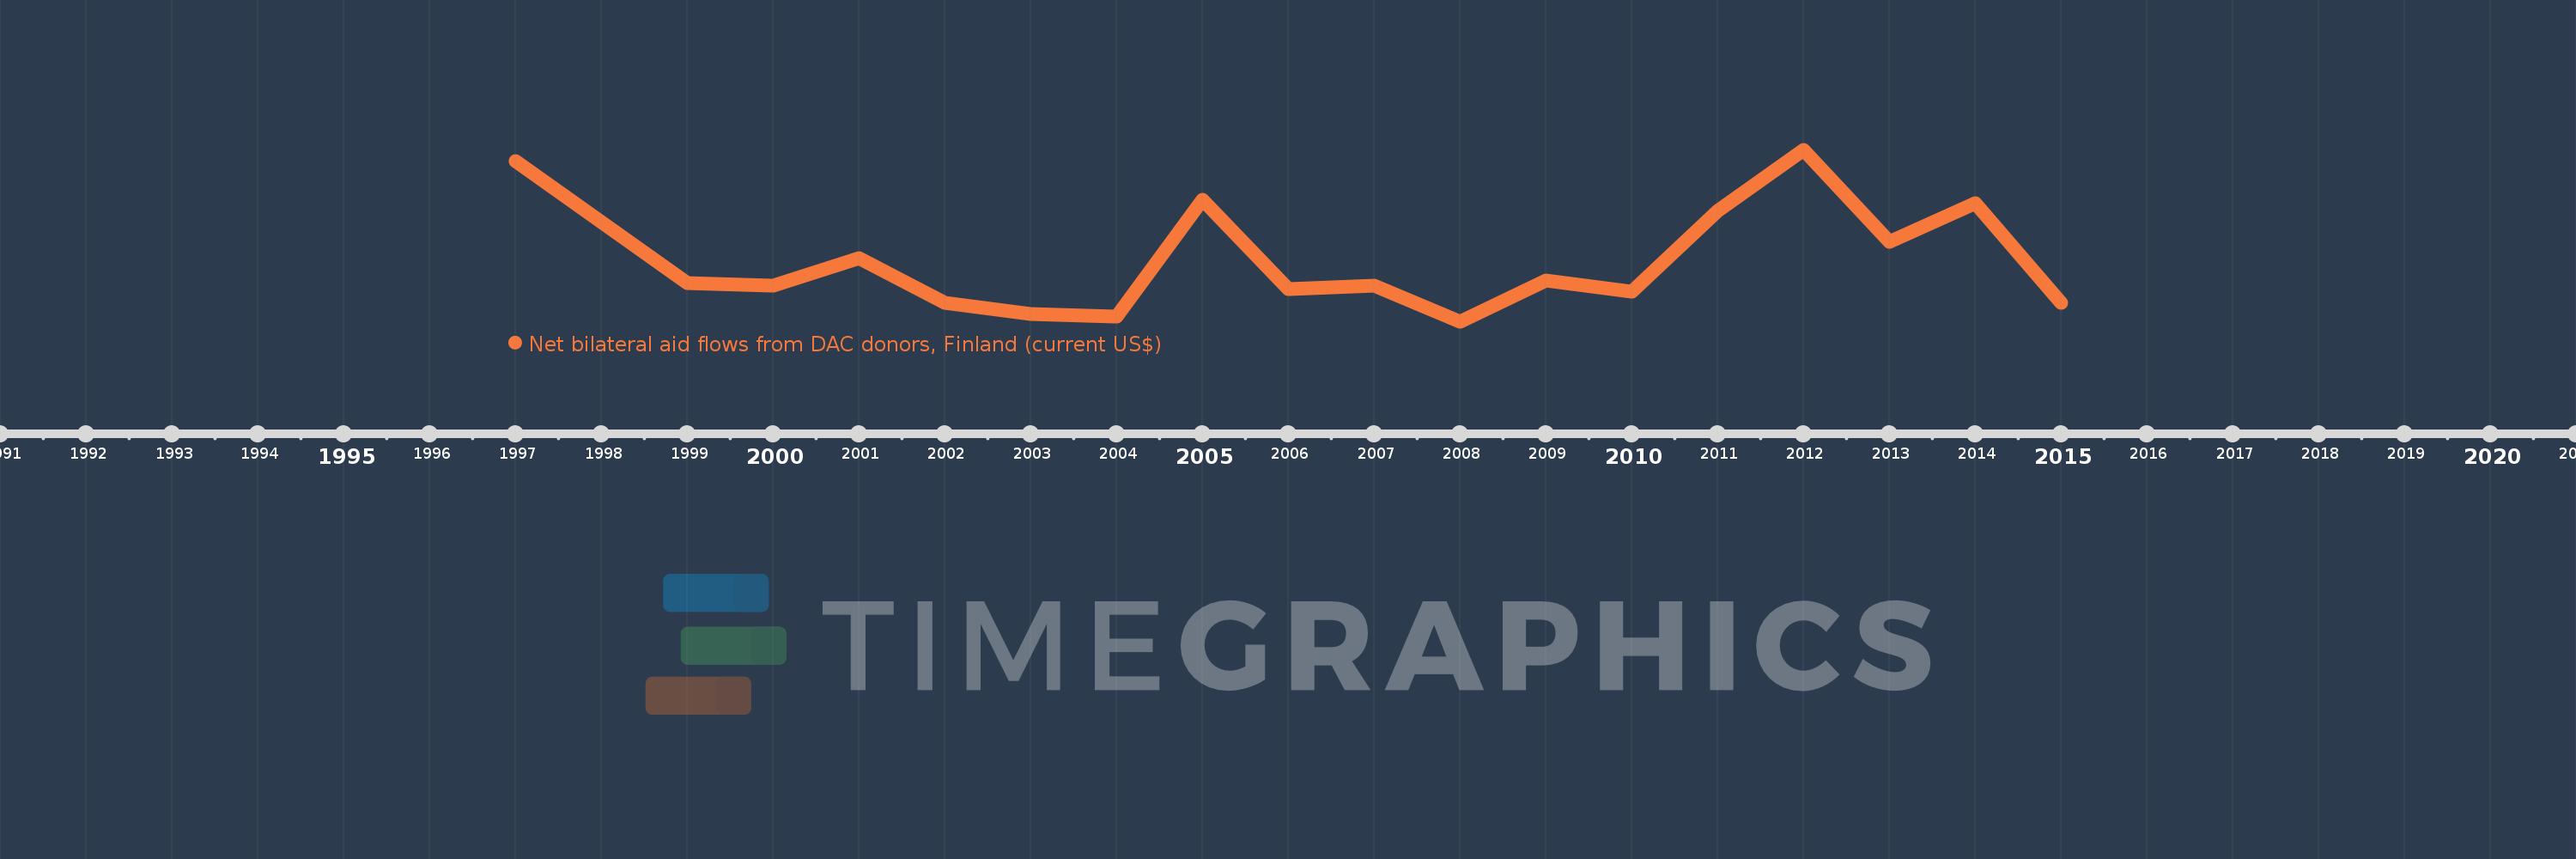
This timeline shows a graph from 1997 to 2015 of Azerbaijan. No data until 1996. Number of actual observations by date: 18.
Source name:
World Development Indicators
Source organization:
Development Assistance Committee of the Organisation for Economic Co-operation and Development, Geographical Distribution of Financial Flows to Developing Countries, Development Co-operation Report, and International Development Statistics database. Data are available online at: www.oecd.org/dac/stats/idsonline.
Categories, topics:
Aid Effectiveness
Last updated:
apr 23, 2017
Indicators value changes by year
Meaning:
270.0K
Minimum:
50.0K
jan 1, 2008
Maximum:
670.0K
jan 1, 2012
At the date of observation
Value
Absolute change
Change from the previous value
jan 1, 1997
630.0K
+630.0K
0.0%
jan 1, 1999
190.0K
-440.0K
-69.84%
jan 1, 2000
180.0K
-10.0K
-5.26%
jan 1, 2001
280.0K
+100.0K
55.56%
jan 1, 2002
120.0K
-160.0K
-57.14%
jan 1, 2003
80.0K
-40.0K
-33.33%
jan 1, 2004
70.0K
-10.0K
-12.5%
jan 1, 2005
490.0K
+420.0K
600.0%
jan 1, 2006
170.0K
-320.0K
-65.31%
jan 1, 2007
180.0K
+10.0K
5.88%
jan 1, 2008
50.0K
-130.0K
-72.22%
jan 1, 2009
200.0K
+150.0K
300.0%
jan 1, 2010
160.0K
-40.0K
-20.0%
jan 1, 2011
450.0K
+290.0K
181.25%
jan 1, 2012
670.0K
+220.0K
48.89%
jan 1, 2013
340.0K
-330.0K
-49.25%
jan 1, 2014
480.0K
+140.0K
41.18%
jan 1, 2015
120.0K
-360.0K
-75.0%
Ranking of countries by current statistics by years
