29
/
en
AIzaSyAYiBZKx7MnpbEhh9jyipgxe19OcubqV5w
April 1, 2024
273926
Ukraine
UKR
true
2
1
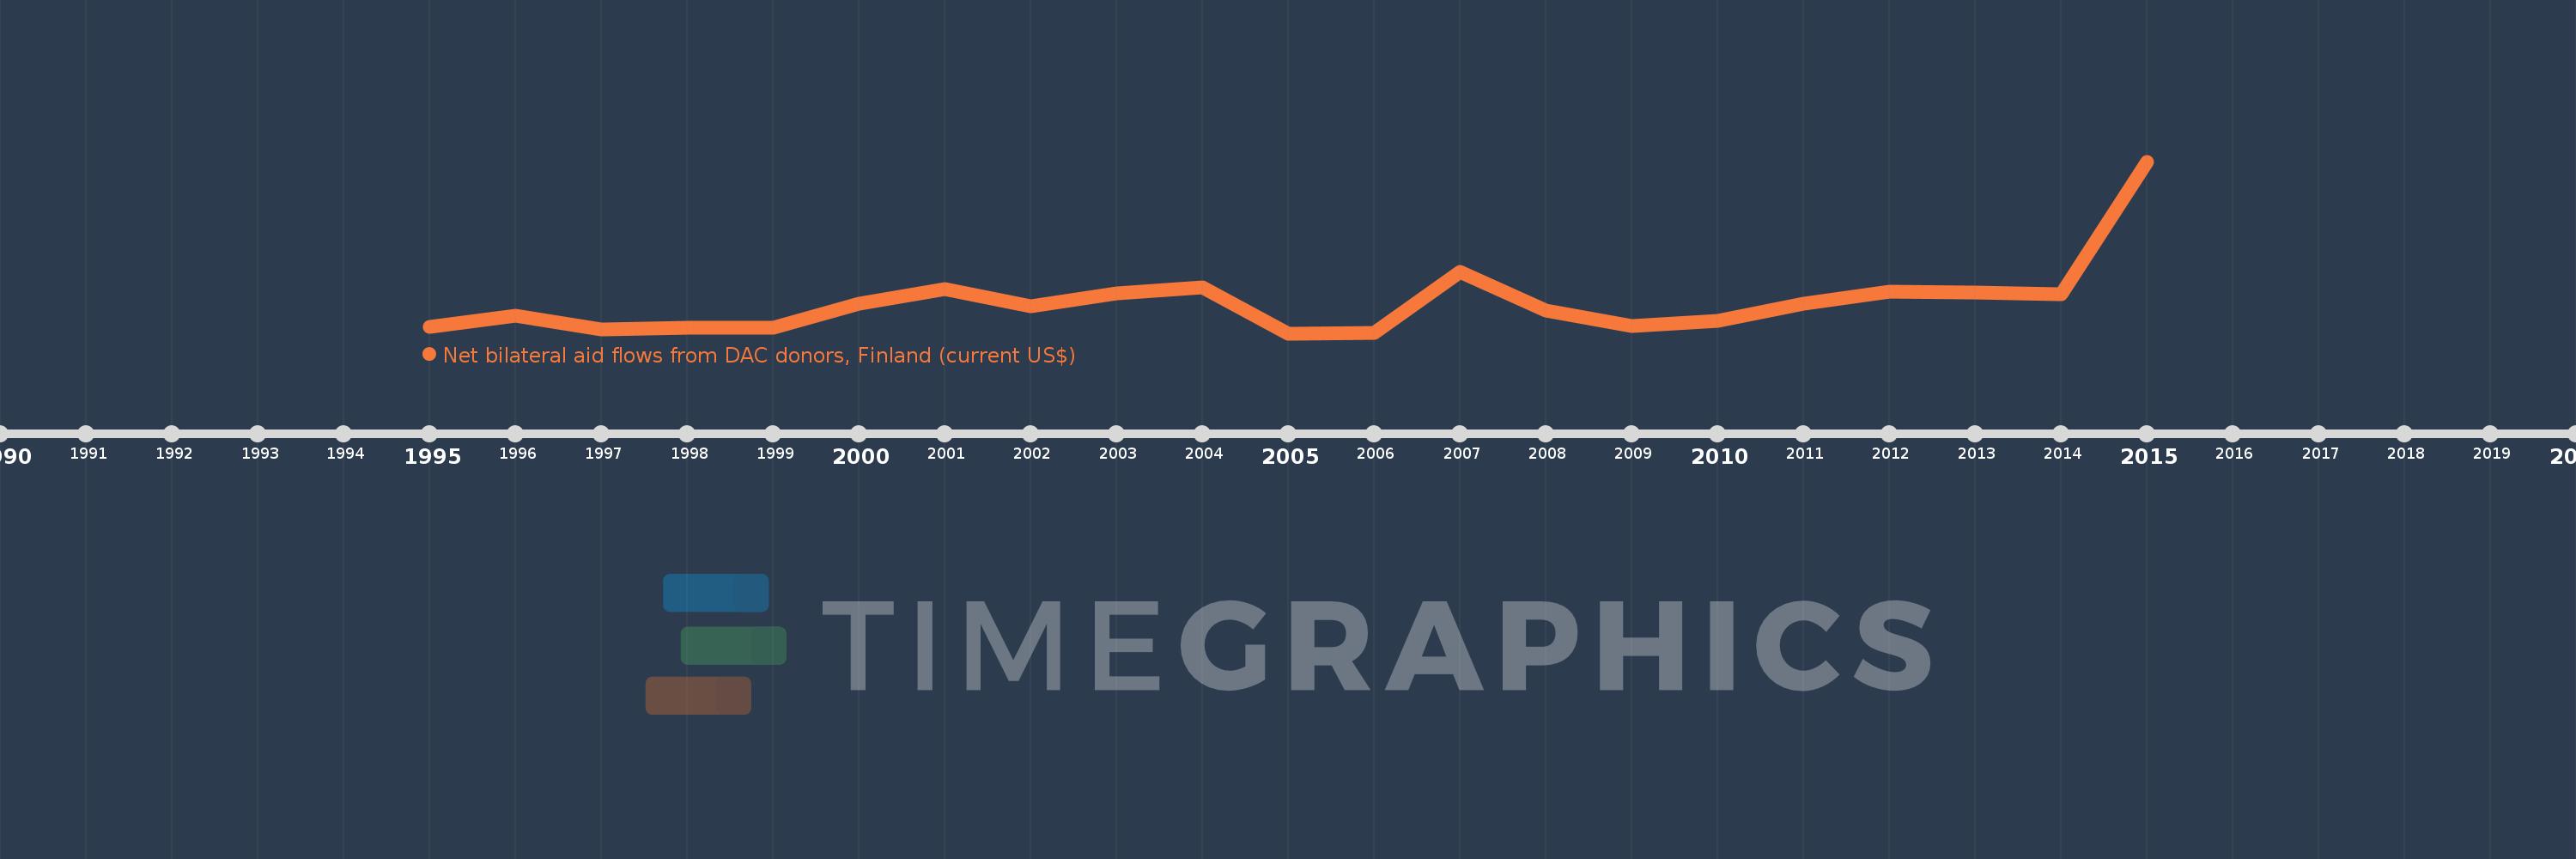
Net bilateral aid flows from DAC donors, Finland (current US$)
2015,2014,2013,2012,2011,2010,2009,2008,2007,2006,2005,2004,2003,2002,2001,2000,1999,1998,1997,1996,1995
This statistics in other country:
AfghanistanAlbaniaAlgeriaAngolaAntigua and BarbudaArab WorldArgentinaArmeniaAzerbaijanBahamas, TheBahrainBangladeshBarbadosBelarusBelizeBeninBhutanBoliviaBosnia and HerzegovinaBotswanaBrazilBrunei DarussalamBulgariaBurkina FasoBurundiCabo VerdeCambodiaCameroonCaribbean small statesCayman IslandsCentral African RepublicCentral Europe and the BalticsChadChileChinaColombiaComorosCongo, Dem. Rep.Congo, Rep.Costa RicaCote d'IvoireCroatiaCubaCyprusCzech RepublicDjiboutiDominicaDominican RepublicEast Asia & PacificEast Asia & Pacific (excluding high income)East Asia & Pacific (IDA & IBRD countries)EcuadorEgypt, Arab Rep.El SalvadorEquatorial GuineaEritreaEstoniaEthiopiaEuro areaEurope & Central AsiaEurope & Central Asia (excluding high income)Europe & Central Asia (IDA & IBRD countries)European UnionFijiFragile and conflict affected situationsFrench PolynesiaGabonGambia, TheGeorgiaGhanaGrenadaGuatemalaGuineaGuinea-BissauGuyanaHaitiHeavily indebted poor countries (HIPC)High incomeHondurasHong Kong SAR, ChinaHungaryIBRD onlyIDA & IBRD totalIDA blendIDA onlyIDA totalIndiaIndonesiaIran, Islamic Rep.IraqIsraelJamaicaJordanKazakhstanKenyaKiribatiKorea, Dem. People’s Rep.Korea, Rep.KosovoKuwaitKyrgyz RepublicLao PDRLatin America & Caribbean Latin America & Caribbean (excluding high income)Latin America & the Caribbean (IDA & IBRD countries)LatviaLeast developed countries: UN classificationLebanonLesothoLiberiaLibyaLithuaniaLow & middle incomeLow incomeLower middle incomeMacedonia, FYRMadagascarMalawiMalaysiaMaldivesMaliMauritaniaMauritiusMexicoMiddle East & North AfricaMiddle East & North Africa (excluding high income)Middle East & North Africa (IDA & IBRD countries)Middle incomeMoldovaMongoliaMontenegroMoroccoMozambiqueMyanmarNamibiaNepalNew CaledoniaNicaraguaNigerNigeriaNorthern Mariana IslandsOECD membersOmanOther small statesPacific island small statesPakistanPalauPanamaPapua New GuineaParaguayPeruPhilippinesPolandRomaniaRussian FederationRwandaSamoaSao Tome and PrincipeSaudi ArabiaSenegalSerbiaSeychellesSierra LeoneSingaporeSlovak RepublicSmall statesSolomon IslandsSomaliaSouth AfricaSouth AsiaSouth Asia (IDA & IBRD)South SudanSri LankaSt. Kitts and NevisSt. LuciaSt. Vincent and the GrenadinesSub-Saharan Africa Sub-Saharan Africa (excluding high income)Sub-Saharan Africa (IDA & IBRD countries)SudanSurinameSwazilandSyrian Arab RepublicTajikistanTanzaniaThailandTimor-LesteTogoTongaTrinidad and TobagoTunisiaTurkeyTurkmenistanTuvaluUgandaUkraineUnited Arab EmiratesUpper middle incomeUruguayUzbekistanVanuatuVenezuela, RBVietnamWest Bank and GazaWorldYemen, Rep.ZambiaZimbabwe Timeline:
This timeline shows a graph from 1995 to 2015 of Ukraine. No data until 1994. Number of actual observations by date: 21.
Source name:
World Development Indicators
Source organization:
Development Assistance Committee of the Organisation for Economic Co-operation and Development, Geographical Distribution of Financial Flows to Developing Countries, Development Co-operation Report, and International Development Statistics database. Data are available online at: www.oecd.org/dac/stats/idsonline.
Categories, topics:
Aid Effectiveness
Last updated:
apr 23, 2017
Indicators value changes by year
Maximum:
6.84 mln
jan 1, 2015
At the date of observation
Value
Absolute change
Change from previous value
jan 1, 1995
280.0K
+280.0K
0.0%
jan 1, 1996
730.0K
+450.0K
160.71%
jan 1, 1997
190.0K
-540.0K
-73.97%
jan 1, 1998
250.0K
+60.0K
31.58%
jan 1, 1999
250.0K
0.0
0.0%
jan 1, 2000
1.2 mln
+950.0K
380.0%
jan 1, 2001
1.77 mln
+570.0K
47.5%
jan 1, 2002
1.09 mln
-680.0K
-38.42%
jan 1, 2003
1.63 mln
+540.0K
49.54%
jan 1, 2004
1.84 mln
+210.0K
12.88%
jan 1, 2005
30.0K
-1.81 mln
-98.37%
jan 1, 2006
50.0K
+20.0K
66.67%
jan 1, 2007
2.47 mln
+2.42 mln
4.84K%
jan 1, 2008
930.0K
-1.54 mln
-62.35%
jan 1, 2009
320.0K
-610.0K
-65.59%
jan 1, 2010
520.0K
+200.0K
62.5%
jan 1, 2011
1.19 mln
+670.0K
128.85%
jan 1, 2012
1.67 mln
+480.0K
40.34%
jan 1, 2013
1.66 mln
-10.0K
-0.6%
jan 1, 2014
1.57 mln
-90.0K
-5.42%
jan 1, 2015
6.84 mln
+5.27 mln
335.67%
Ranking of countries by current statistics by years


Comments: