29
/
en
AIzaSyAYiBZKx7MnpbEhh9jyipgxe19OcubqV5w
April 1, 2024
73676
Austria
AUT
true
2
1
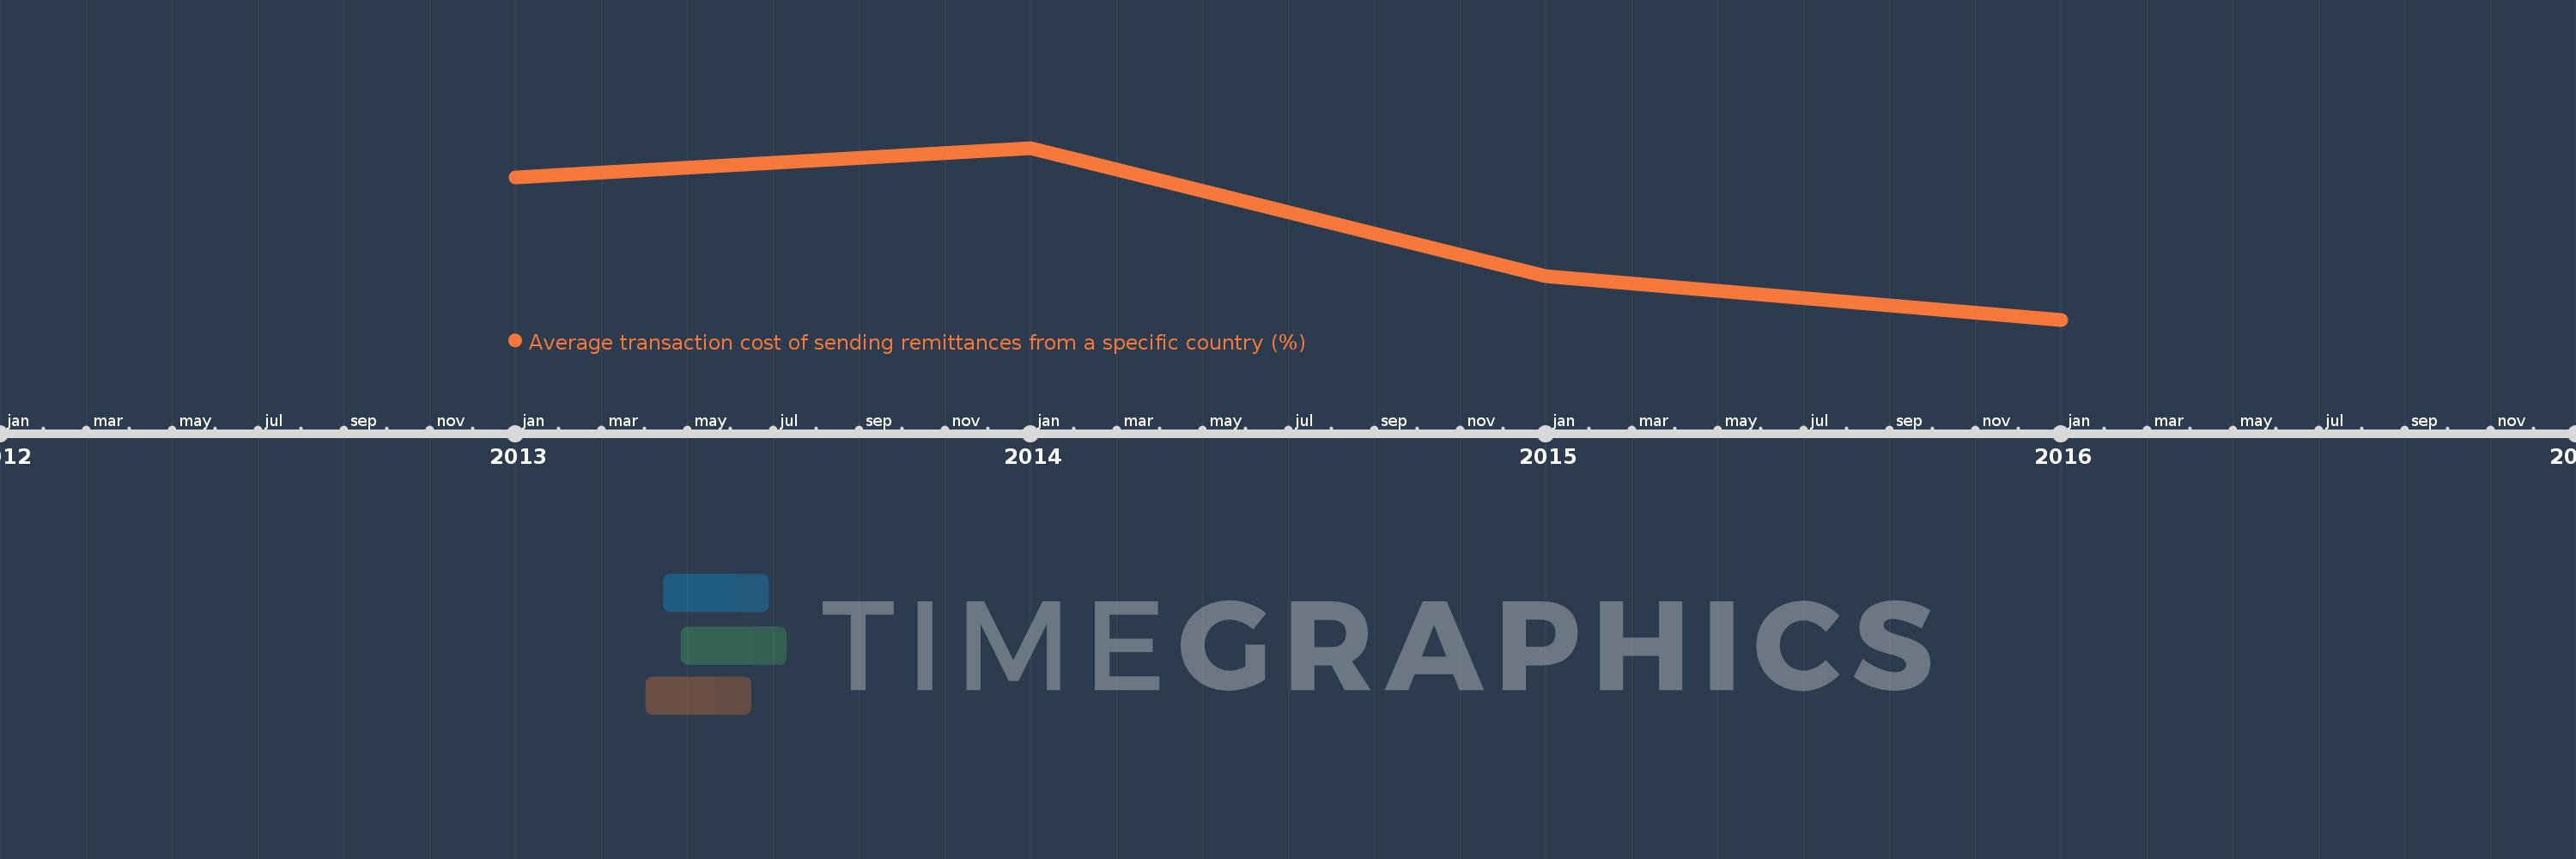
Average transaction cost of sending remittances from a specific country (%)
2016,2015,2014,2013
This statistics in other country:
Timeline:
This timeline shows a graph from 2013 to 2016 of Austria. No data until 2012. Number of actual observations by date: 4.
Source name:
World Development Indicators
Source organization:
World Bank, Remittance Prices Worldwide, available at http://remittanceprices.worldbank.org
Categories, topics:
Financial Sector
Last updated:
apr 23, 2017
Indicators value changes by year
At the date of observation
Value
Absolute change
Change from previous value
jan 1, 2013
8.367
+8.367
0.0%
jan 1, 2014
8.809
+0.442
5.28%
jan 1, 2015
6.904
-1.904
-21.62%
jan 1, 2016
6.257
-0.647
-9.38%
Ranking of countries by current statistics by years


Comments: