29
/
en
AIzaSyAYiBZKx7MnpbEhh9jyipgxe19OcubqV5w
April 1, 2024
257066
Switzerland
CHE
true
2
1
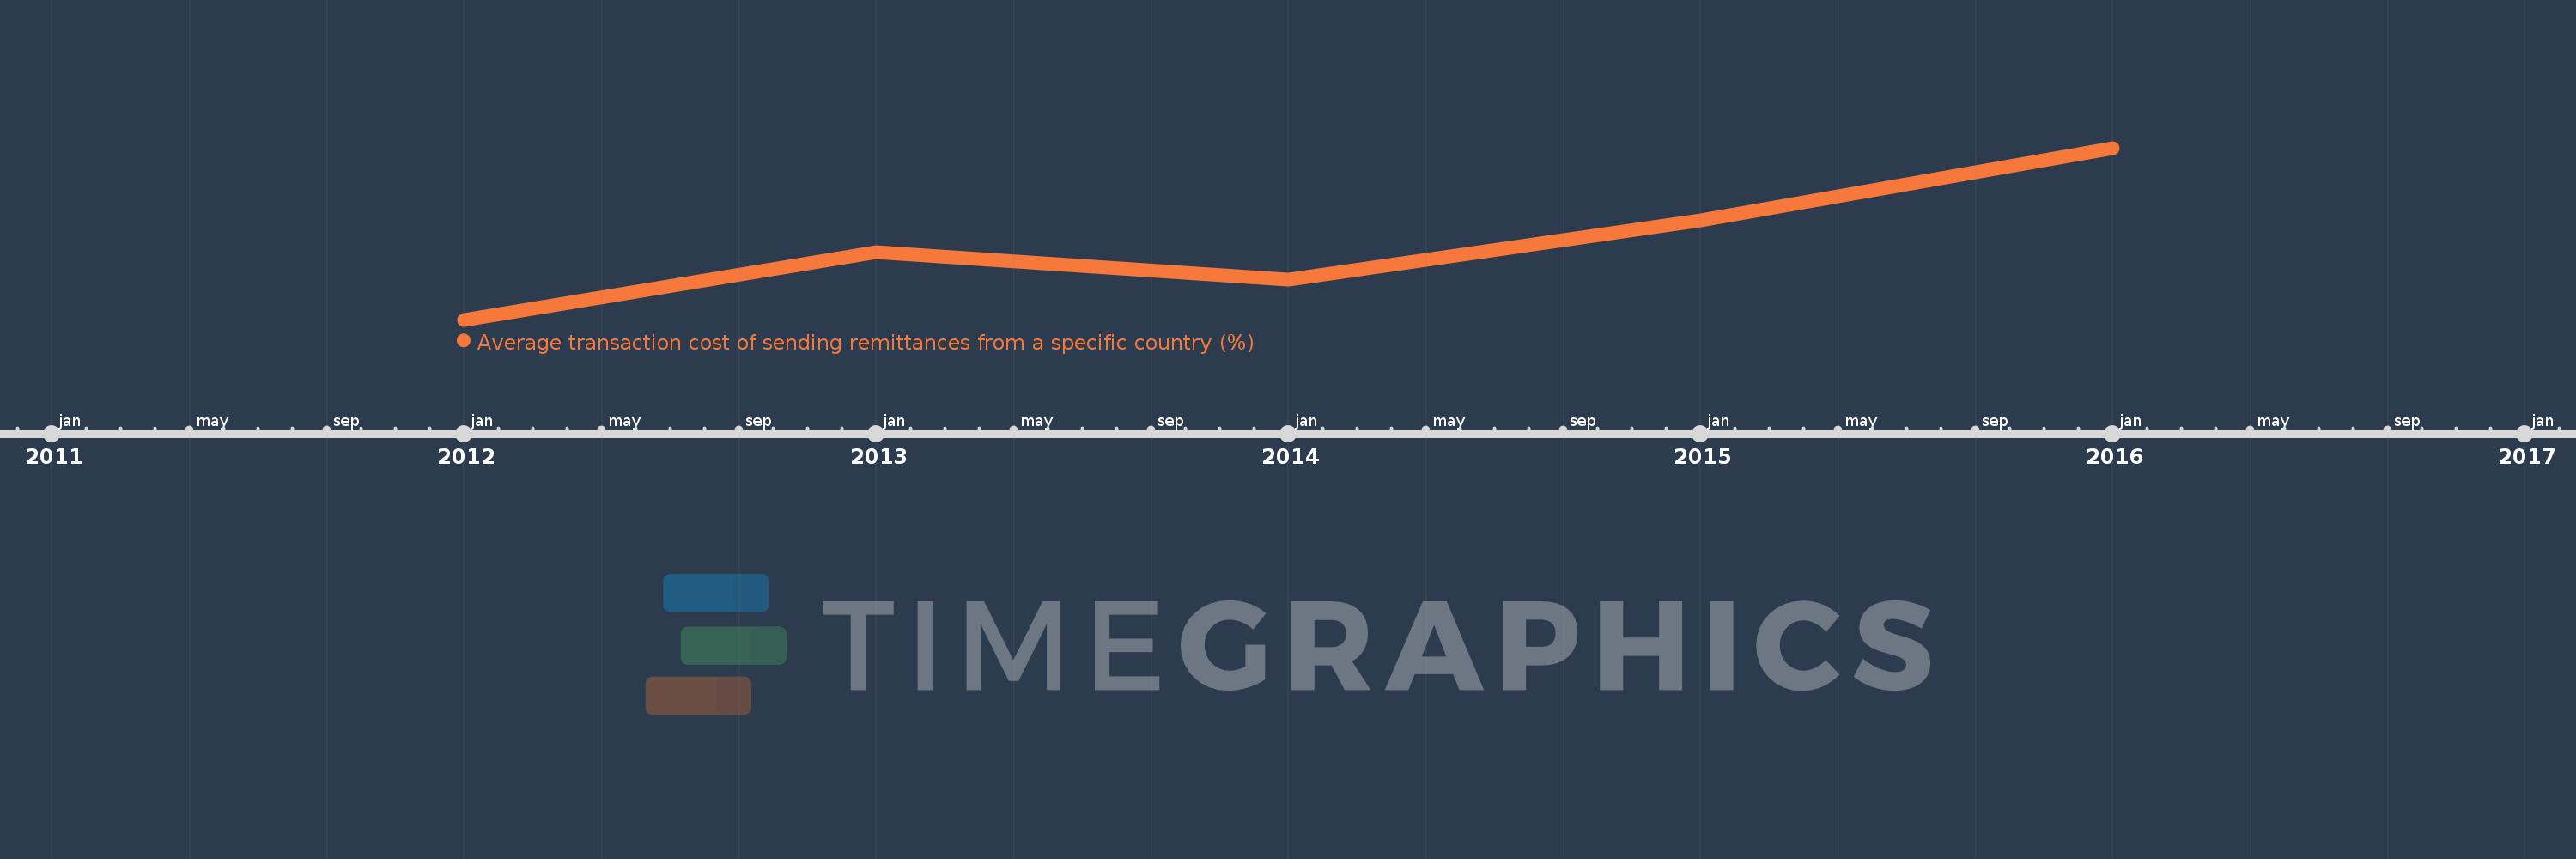
Average transaction cost of sending remittances from a specific country (%)
2016,2015,2014,2013,2012
This statistics in other country:
Timeline:
This timeline shows a graph from 2012 to 2016 of Switzerland. No data until 2011. Number of actual observations by date: 5.
Source name:
World Development Indicators
Source organization:
World Bank, Remittance Prices Worldwide, available at http://remittanceprices.worldbank.org
Categories, topics:
Financial Sector
Last updated:
apr 23, 2017
Indicators value changes by year
Maximum:
14.844
jan 1, 2016
At the date of observation
Value
Absolute change
Change from previous value
jan 1, 2012
9.423
+9.423
0.0%
jan 1, 2013
11.567
+2.144
22.76%
jan 1, 2014
10.682
-0.886
-7.66%
jan 1, 2015
12.56
+1.878
17.58%
jan 1, 2016
14.844
+2.284
18.18%
Ranking of countries by current statistics by years


Comments: