29
/
en
AIzaSyAYiBZKx7MnpbEhh9jyipgxe19OcubqV5w
April 1, 2024
70958
Armenia
ARM
true
2
1
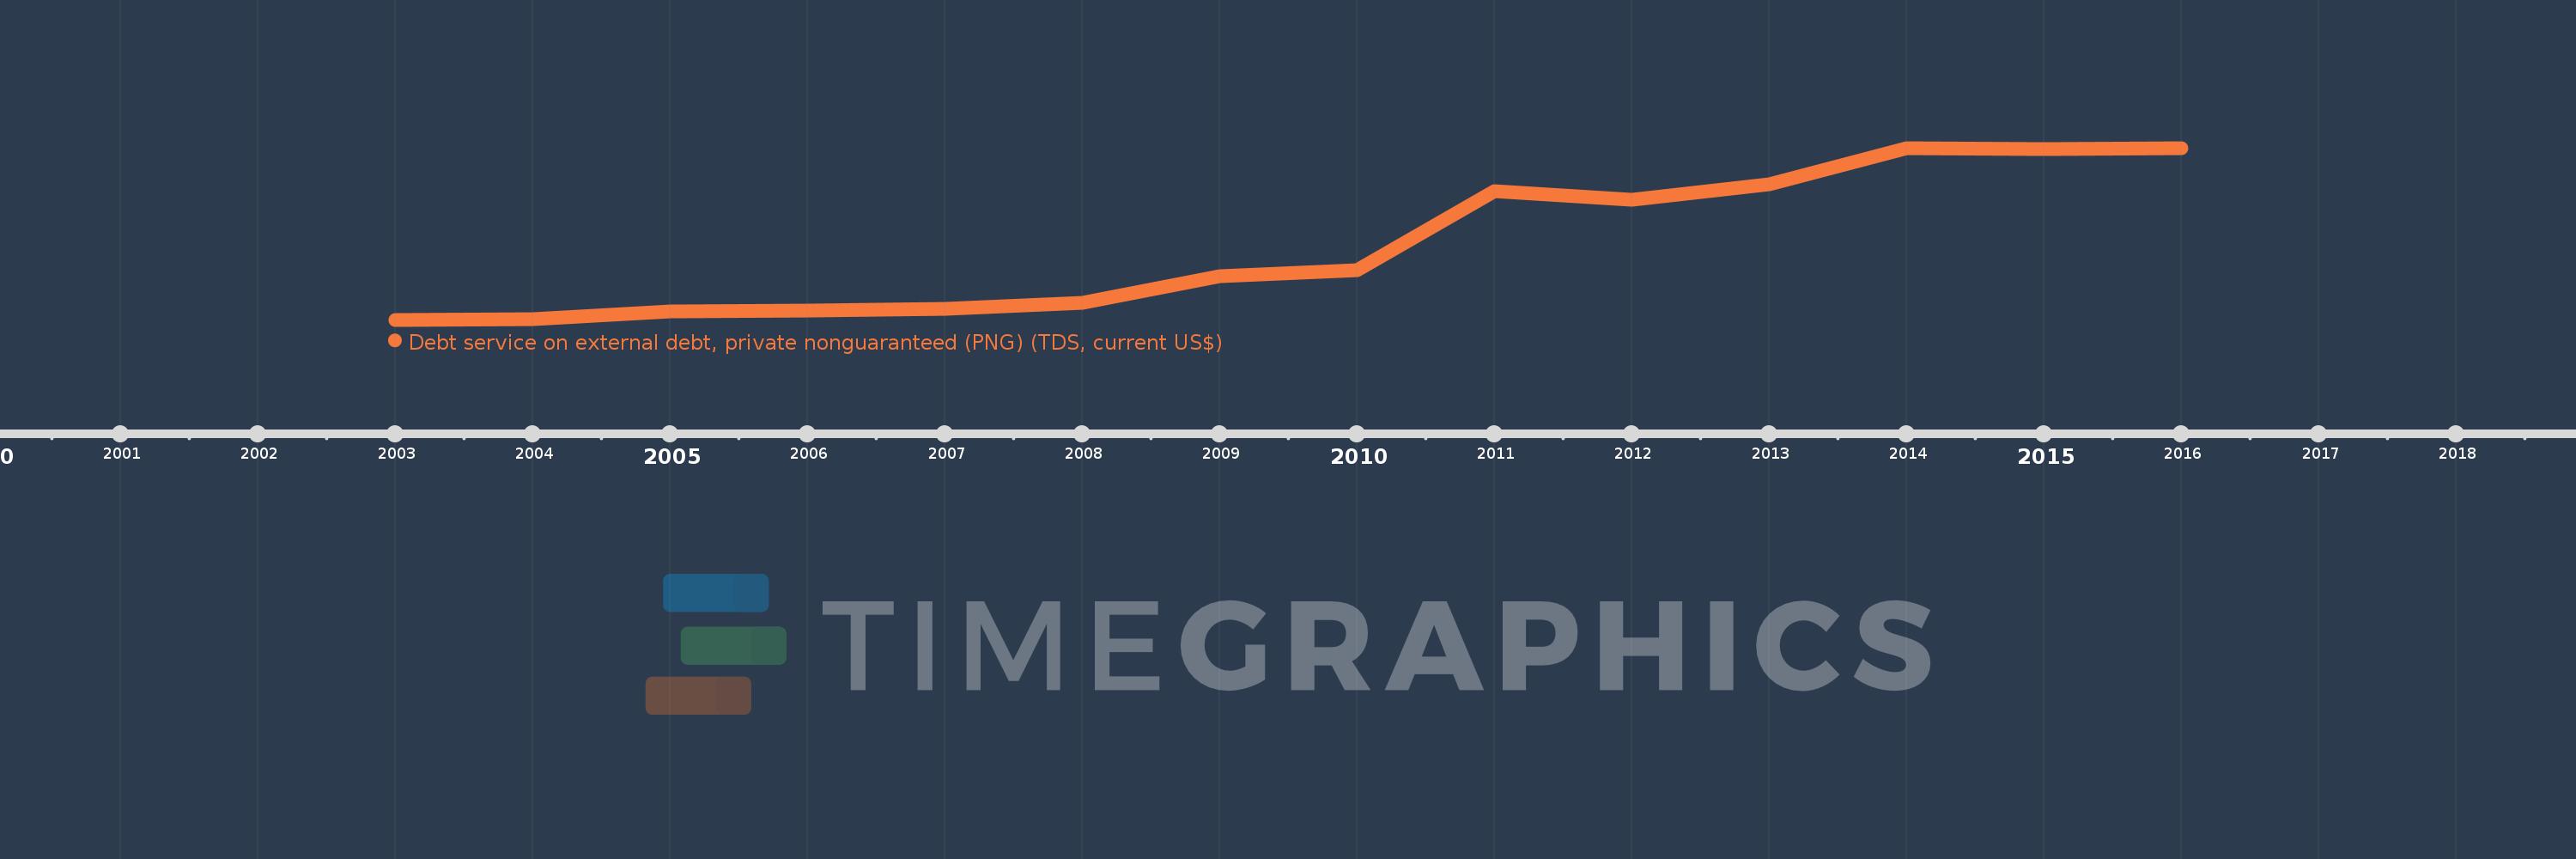
Debt service on external debt, private nonguaranteed (PNG) (TDS, current US$)
2016,2015,2014,2013,2012,2011,2010,2009,2008,2007,2006,2005,2004,2003
This statistics in other country:
Timeline:
This timeline shows a graph from 2003 to 2016 of Armenia. No data until 2002. Number of actual observations by date: 14.
Source name:
World Development Indicators
Source organization:
World Bank, International Debt Statistics.
Categories, topics:
External Debt
Last updated:
apr 23, 2017
Indicators value changes by year
Minimum:
8.63 mln
jan 1, 2003
Maximum:
1.147 bln
jan 1, 2014
At the date of observation
Value
Absolute change
Change from previous value
jan 1, 2003
8.63 mln
+8.63 mln
0.0%
jan 1, 2004
14.53 mln
+5.9 mln
68.37%
jan 1, 2005
61.24 mln
+46.71 mln
321.47%
jan 1, 2006
67.47 mln
+6.23 mln
10.17%
jan 1, 2007
80.99 mln
+13.52 mln
20.04%
jan 1, 2008
122.59 mln
+41.6 mln
51.36%
jan 1, 2009
296.5 mln
+173.91 mln
141.86%
jan 1, 2010
334.63 mln
+38.13 mln
12.86%
jan 1, 2011
858.144 mln
+523.514 mln
156.45%
jan 1, 2012
804.239 mln
-53.905 mln
-6.28%
jan 1, 2013
908.556 mln
+104.317 mln
12.97%
jan 1, 2014
1.147 bln
+238.367 mln
26.24%
jan 1, 2015
1.14 bln
-6.572 mln
-0.57%
jan 1, 2016
1.147 bln
+6.351 mln
0.56%
Ranking of countries by current statistics by years


Comments: