29
/
en
AIzaSyAYiBZKx7MnpbEhh9jyipgxe19OcubqV5w
April 1, 2024
65832
Algeria
DZA
true
2
1
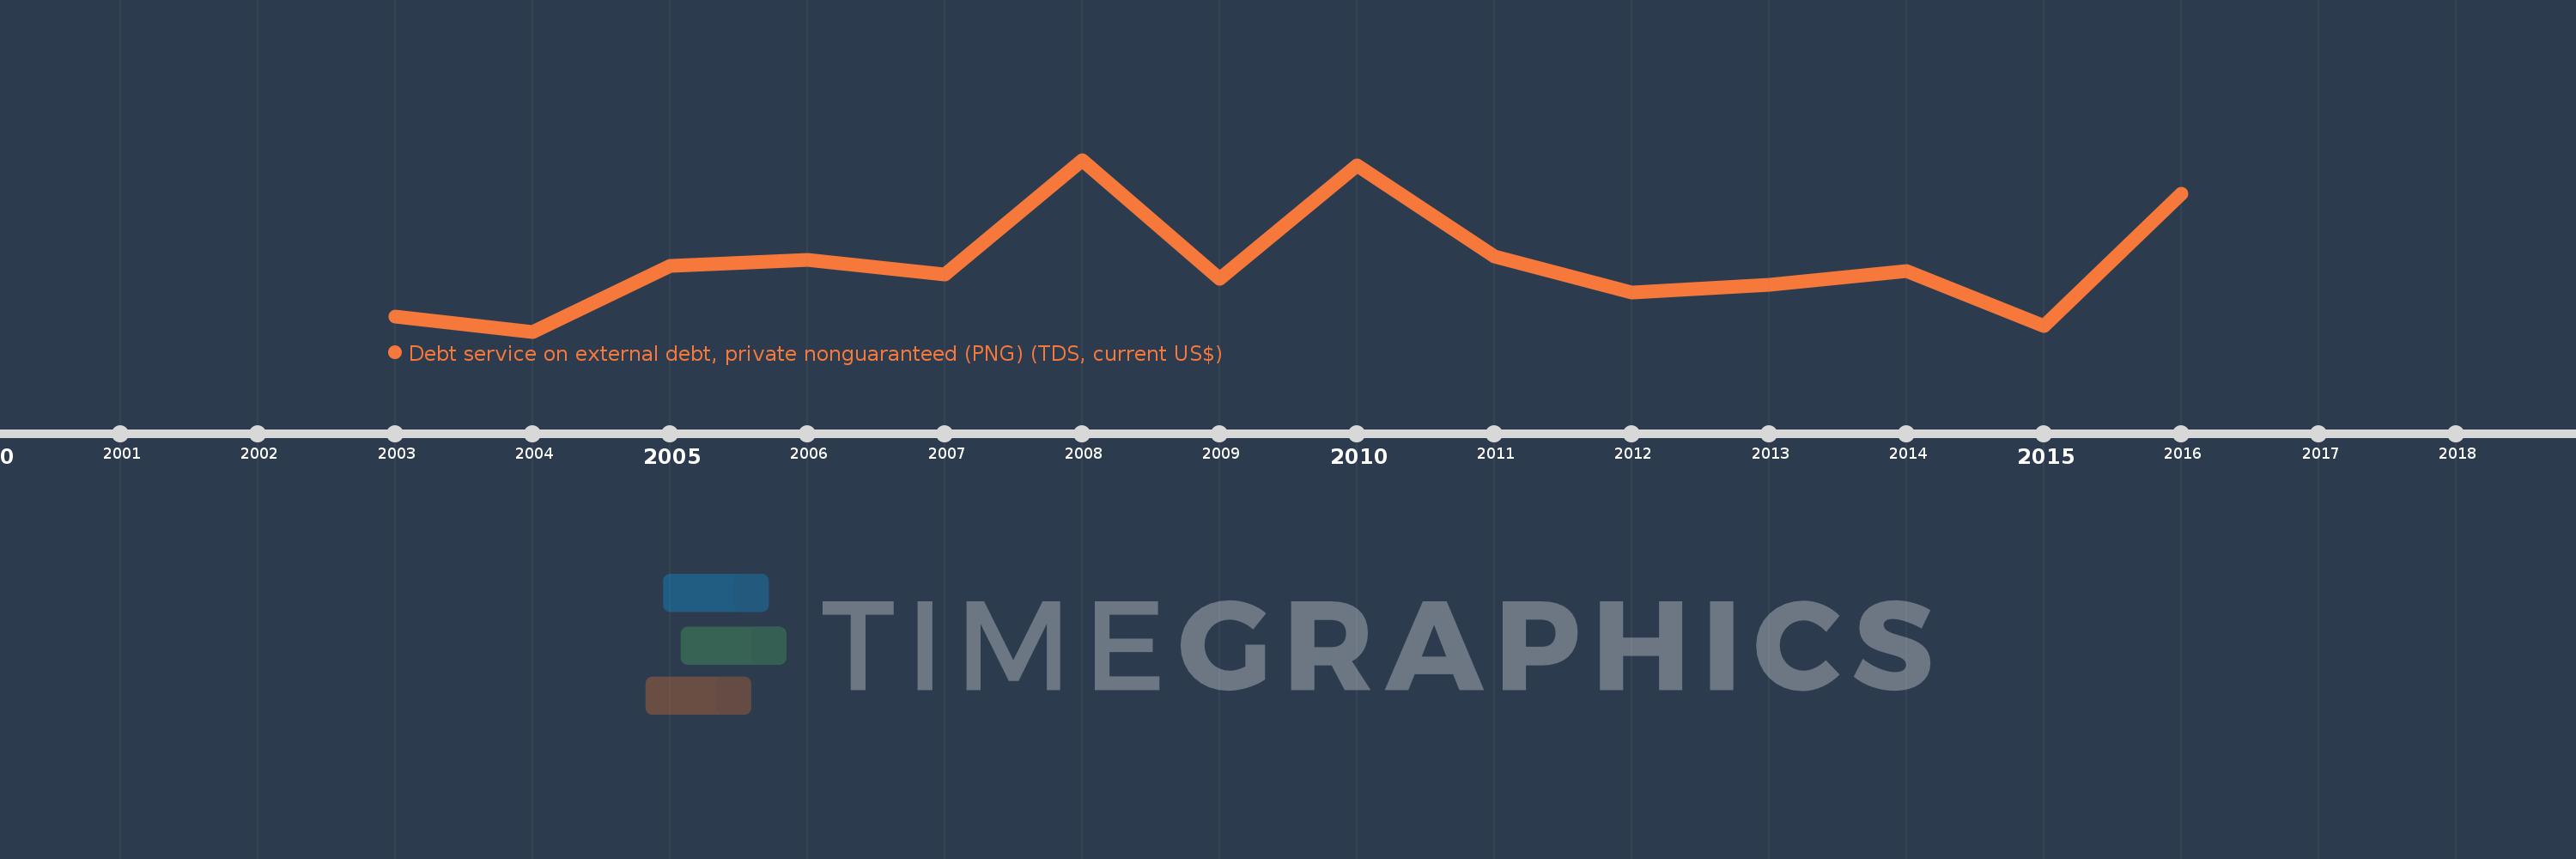
Debt service on external debt, private nonguaranteed (PNG) (TDS, current US$)
2016,2015,2014,2013,2012,2011,2010,2009,2008,2007,2006,2005,2004,2003
This statistics in other country:
Timeline:
This timeline shows a graph from 2003 to 2016 of Algeria. No data until 2002. Number of actual observations by date: 14.
Source name:
World Development Indicators
Source organization:
World Bank, International Debt Statistics.
Categories, topics:
External Debt
Last updated:
apr 23, 2017
Indicators value changes by year
Minimum:
13.774 mln
jan 1, 2004
Maximum:
588.3 mln
jan 1, 2008
At the date of observation
Value
Absolute change
Change from previous value
jan 1, 2003
64.627 mln
+64.627 mln
0.0%
jan 1, 2004
13.774 mln
-50.853 mln
-78.69%
jan 1, 2005
232.913 mln
+219.139 mln
1.59K%
jan 1, 2006
254.055 mln
+21.142 mln
9.08%
jan 1, 2007
204.133 mln
-49.922 mln
-19.65%
jan 1, 2008
588.3 mln
+384.167 mln
188.19%
jan 1, 2009
191.45 mln
-396.85 mln
-67.46%
jan 1, 2010
570.39 mln
+378.94 mln
197.93%
jan 1, 2011
264.02 mln
-306.37 mln
-53.71%
jan 1, 2012
143.39 mln
-120.63 mln
-45.69%
jan 1, 2013
170.95 mln
+27.56 mln
19.22%
jan 1, 2014
215.44 mln
+44.49 mln
26.03%
jan 1, 2015
33.52 mln
-181.92 mln
-84.44%
jan 1, 2016
473.47 mln
+439.95 mln
1.31K%
Ranking of countries by current statistics by years


Comments: