30
/
AIzaSyAYiBZKx7MnpbEhh9jyipgxe19OcubqV5w
April 1, 2024
67475
Angola
AGO
true
2
1
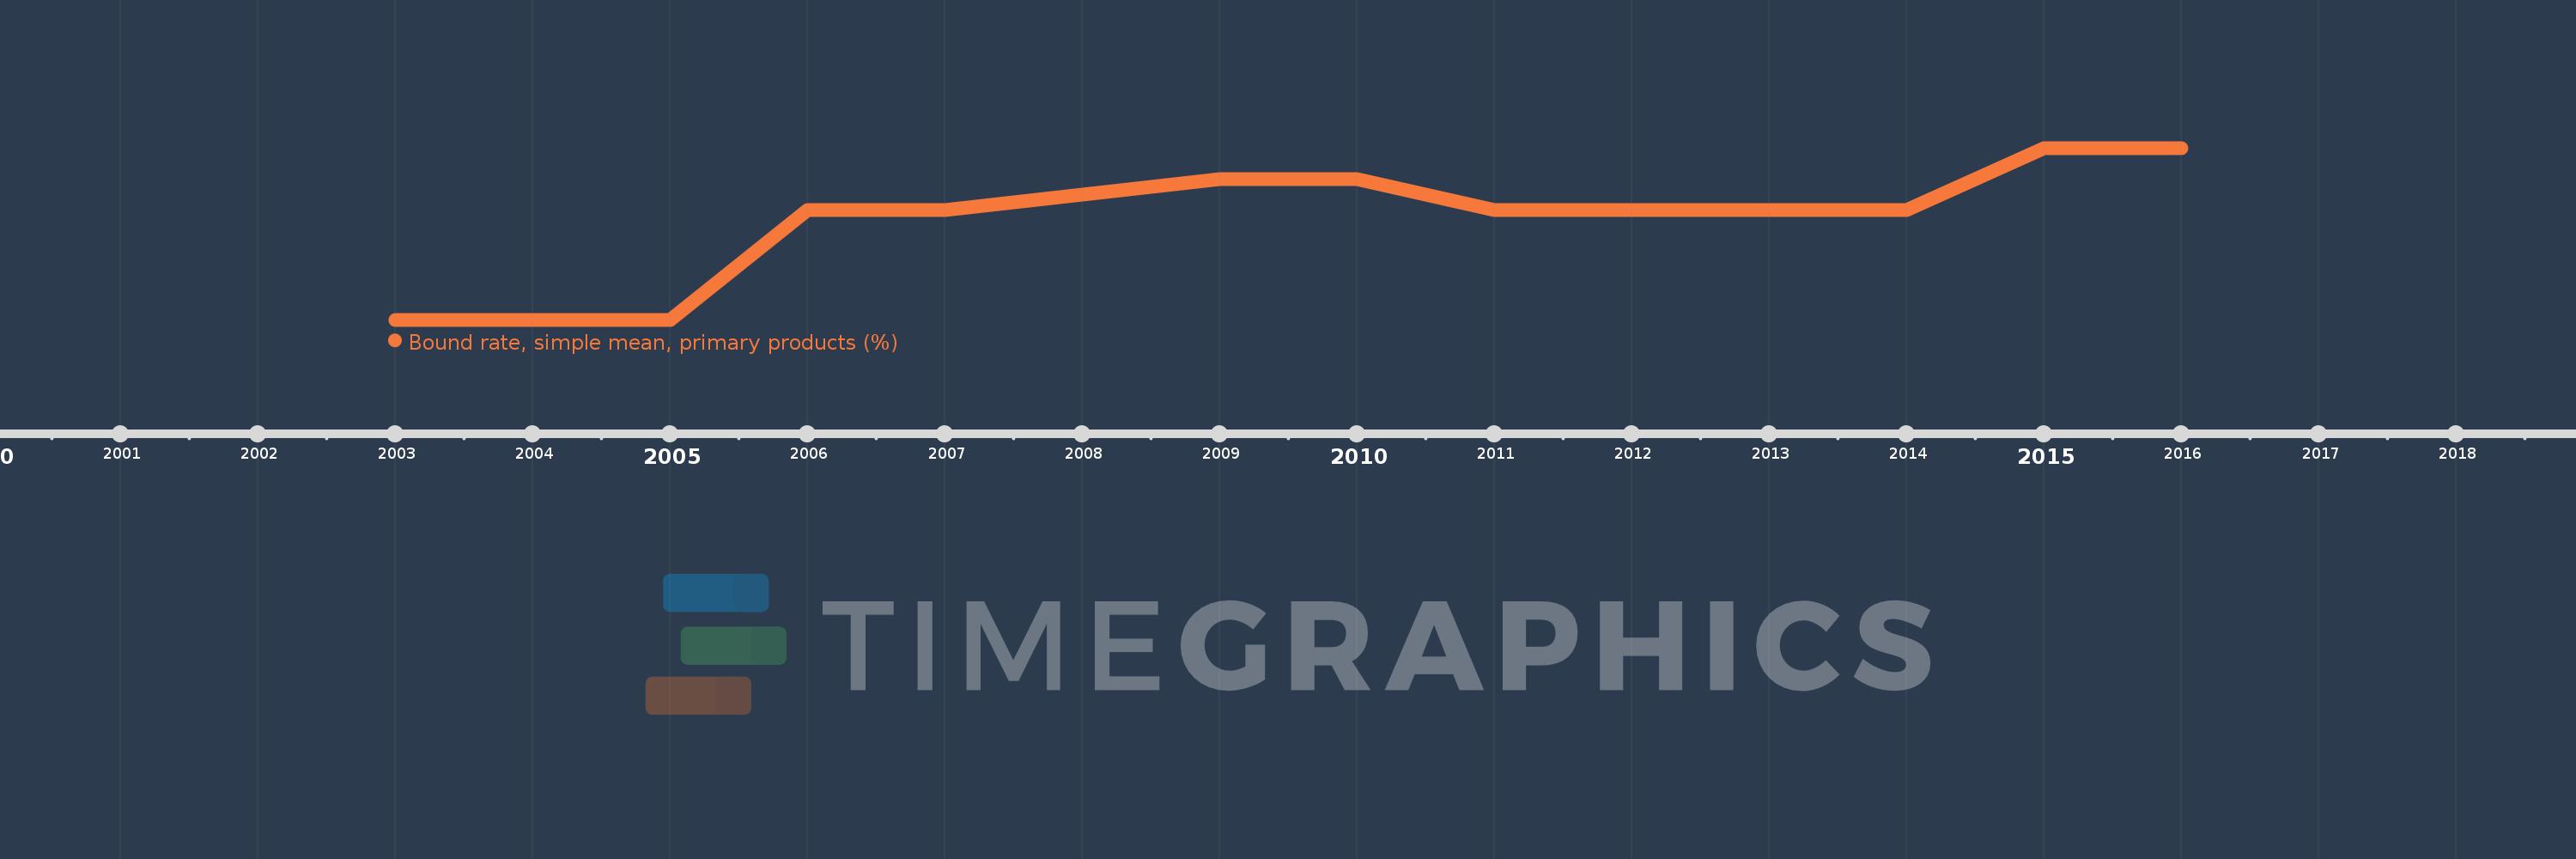
Bound rate, simple mean, primary products (%)
2016,2015,2014,2013,2012,2011,2010,2009,2007,2006,2005,2003
Public Timelines
FAQ
Menu
Public Timelines
FAQ
For education
For educational institutions
For teachers
For students
Open cabinet
Create
Close
Create a timeline
Public timelines
Library
FAQ
Download
Global statistics library
→
Angola
→
Bound rate, simple mean, primary products (%)
This statistics in other country:
Albania
Angola
Antigua and Barbuda
Argentina
Armenia
Australia
Austria
Bahrain
Bangladesh
Barbados
Belgium
Belize
Benin
Bolivia
Botswana
Brazil
Brunei Darussalam
Bulgaria
Burkina Faso
Burundi
Cabo Verde
Cambodia
Cameroon
Canada
Central African Republic
Chad
Chile
China
Colombia
Congo, Dem. Rep.
Congo, Rep.
Costa Rica
Cote d'Ivoire
Cuba
Cyprus
Czech Republic
Denmark
Djibouti
Dominica
Dominican Republic
East Asia & Pacific (excluding high income)
Ecuador
Egypt, Arab Rep.
El Salvador
Estonia
Europe & Central Asia (excluding high income)
European Union
Fiji
Finland
France
Gabon
Gambia, The
Georgia
Germany
Ghana
Greece
Grenada
Guatemala
Guinea
Guinea-Bissau
Guyana
Haiti
High income
Honduras
Hong Kong SAR, China
Hungary
Iceland
India
Indonesia
Ireland
Israel
Italy
Jamaica
Japan
Jordan
Kenya
Korea, Rep.
Kuwait
Kyrgyz Republic
Latin America & Caribbean (excluding high income)
Latvia
Lesotho
Lithuania
Low & middle income
Low income
Lower middle income
Luxembourg
Macao SAR, China
Macedonia, FYR
Madagascar
Malawi
Malaysia
Maldives
Mali
Malta
Mauritania
Mauritius
Mexico
Middle East & North Africa (excluding high income)
Middle income
Moldova
Mongolia
Morocco
Mozambique
Myanmar
Namibia
Nepal
Netherlands
New Zealand
Nicaragua
Niger
Nigeria
Norway
OECD members
Oman
Pakistan
Panama
Papua New Guinea
Paraguay
Peru
Philippines
Poland
Portugal
Qatar
Romania
Rwanda
Saudi Arabia
Senegal
Sierra Leone
Singapore
Slovak Republic
Slovenia
Solomon Islands
South Africa
South Asia
Spain
Sri Lanka
St. Kitts and Nevis
St. Lucia
St. Vincent and the Grenadines
Sub-Saharan Africa (excluding high income)
Suriname
Swaziland
Sweden
Switzerland
Tanzania
Thailand
Togo
Tonga
Trinidad and Tobago
Tunisia
Turkey
Uganda
Ukraine
United Arab Emirates
United Kingdom
United States
Upper middle income
Uruguay
Venezuela, RB
Vietnam
World
Zambia
Zimbabwe
Timeline:
This timeline shows a graph from
2003
to
2016
of Angola. No data until
2002
. Number of actual observations by date:
12
.
Source name:
World Development Indicators
Source organization:
World Bank staff estimates using the World Integrated Trade Solution system, based on data from World Trade Organization.
Categories, topics:
Private Sector, Trade
Last updated:
apr 23, 2017
Indicators value changes by year
Meaning:
56.268
Minimum:
56.2
jan 1, 2003
Maximum:
56.31
jan 1, 2015
At the date of observation
Value
Absolute change
Change from the previous value
jan 1, 2003
56.2
+56.2
0.0%
jan 1, 2005
56.2
0.0
0.0%
jan 1, 2006
56.27
+0.07
0.12%
jan 1, 2007
56.27
0.0
0.0%
jan 1, 2009
56.29
+0.02
0.04%
jan 1, 2010
56.29
0.0
0.0%
jan 1, 2011
56.27
-0.02
-0.04%
jan 1, 2012
56.27
0.0
0.0%
jan 1, 2013
56.27
0.0
0.0%
jan 1, 2014
56.27
0.0
0.0%
jan 1, 2015
56.31
+0.04
0.07%
jan 1, 2016
56.31
0.0
0.0%
Ranking of countries by current statistics by years
About & Feedback
Terms
Privacy
Library
2024
©
Time.Graphics
Support 24/7
Cabinet
Get premium
Donate
The service accepts bank transfer (ACH, Wire) or cards (Visa, MasterCard, etc). Processed by Stripe.
Secured with SSL
Excellent (Trustpilot Reviews)
Based on 115+ reviews
Write your own review on
Trustpilot.com
