29
/
en
AIzaSyAYiBZKx7MnpbEhh9jyipgxe19OcubqV5w
April 1, 2024
131746
Fiji
FJI
true
2
1
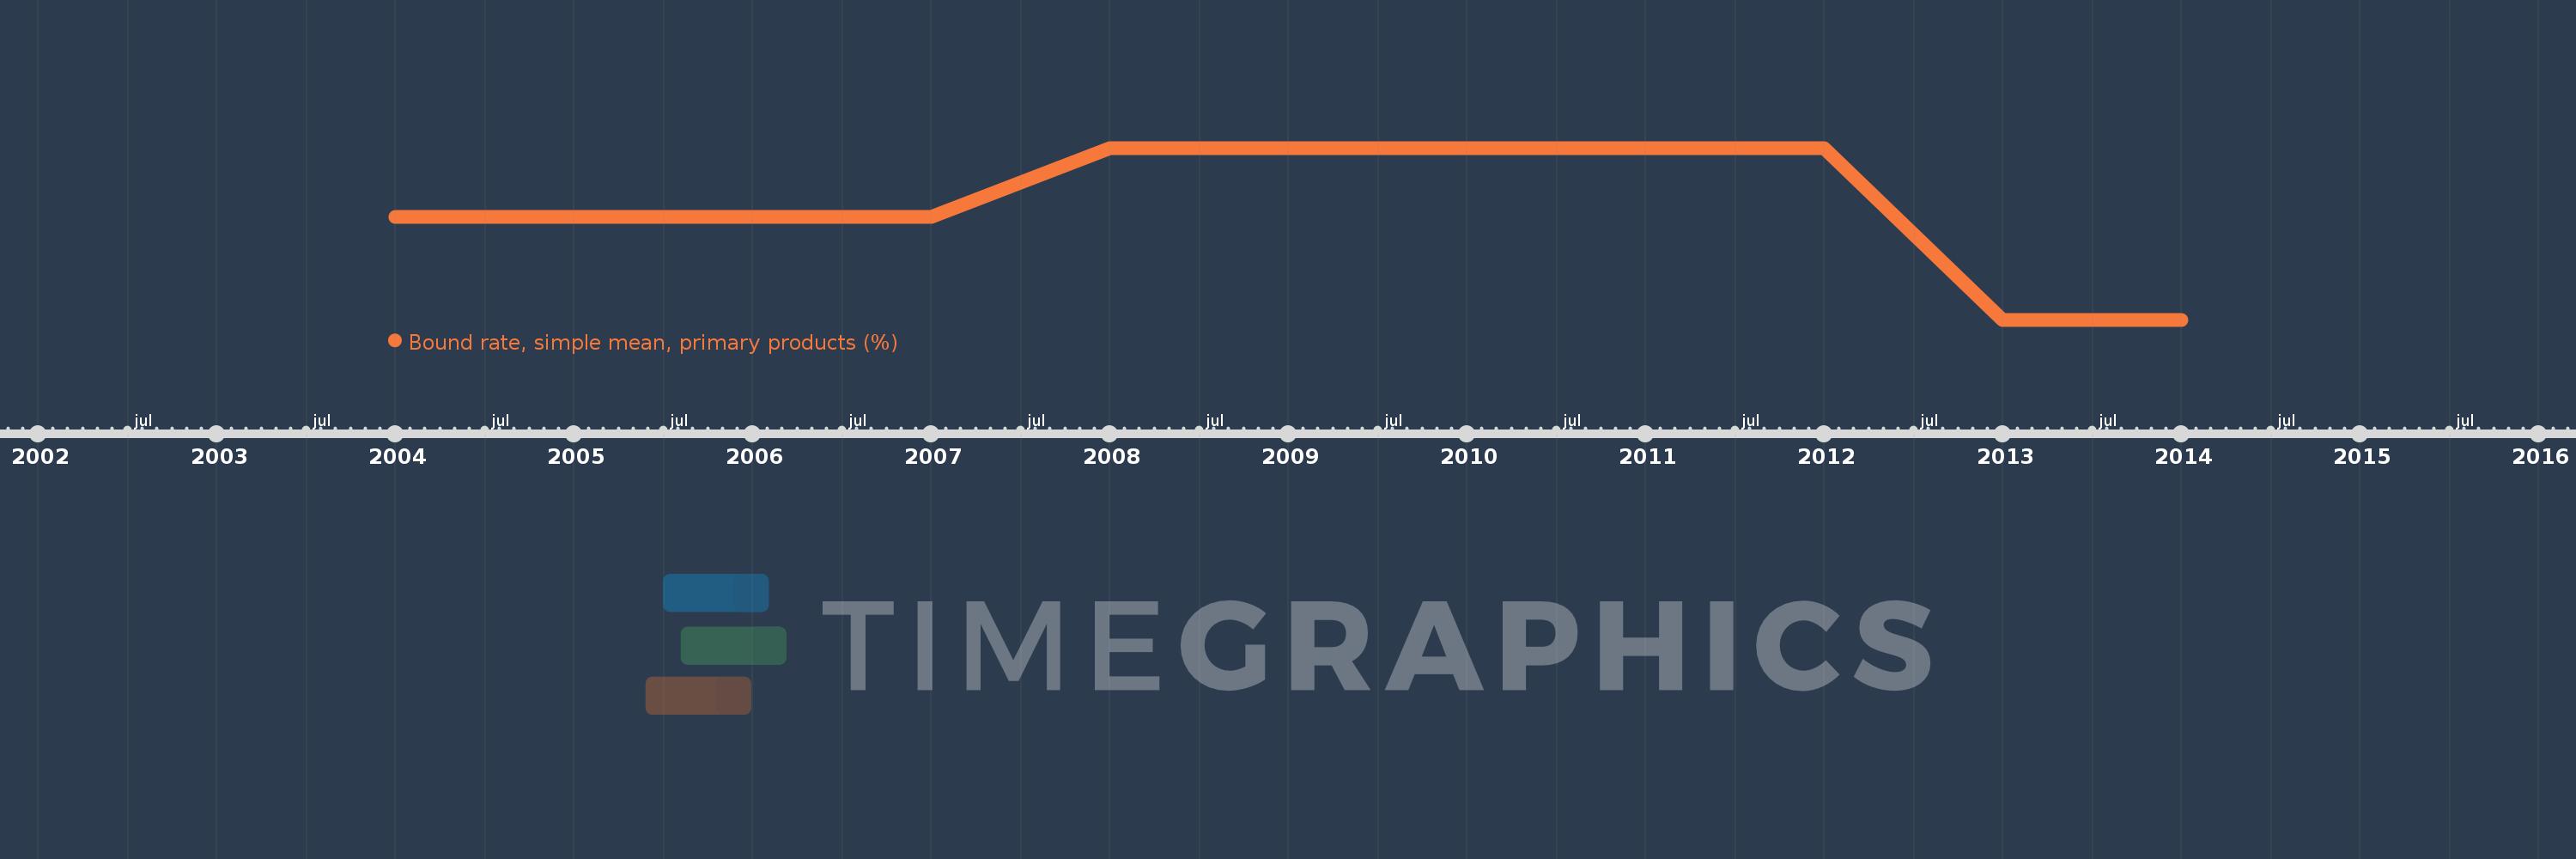
Bound rate, simple mean, primary products (%)
2014,2013,2012,2011,2010,2009,2008,2007,2005,2004
This statistics in other country:
Timeline:
This timeline shows a graph from 2004 to 2014 of Fiji. No data until 2003. Number of actual observations by date: 10.
Source name:
World Development Indicators
Source organization:
World Bank staff estimates using the World Integrated Trade Solution system, based on data from World Trade Organization.
Categories, topics:
Private Sector, Trade
Last updated:
apr 23, 2017
Indicators value changes by year
At the date of observation
Value
Absolute change
Change from previous value
jan 1, 2004
40.44
+40.44
0.0%
jan 1, 2005
40.44
0.0
0.0%
jan 1, 2007
40.44
0.0
0.0%
jan 1, 2008
40.46
+0.02
0.05%
jan 1, 2009
40.46
0.0
0.0%
jan 1, 2010
40.46
0.0
0.0%
jan 1, 2011
40.46
0.0
0.0%
jan 1, 2012
40.46
0.0
0.0%
jan 1, 2013
40.41
-0.05
-0.12%
jan 1, 2014
40.41
0.0
0.0%
Ranking of countries by current statistics by years


Comments: