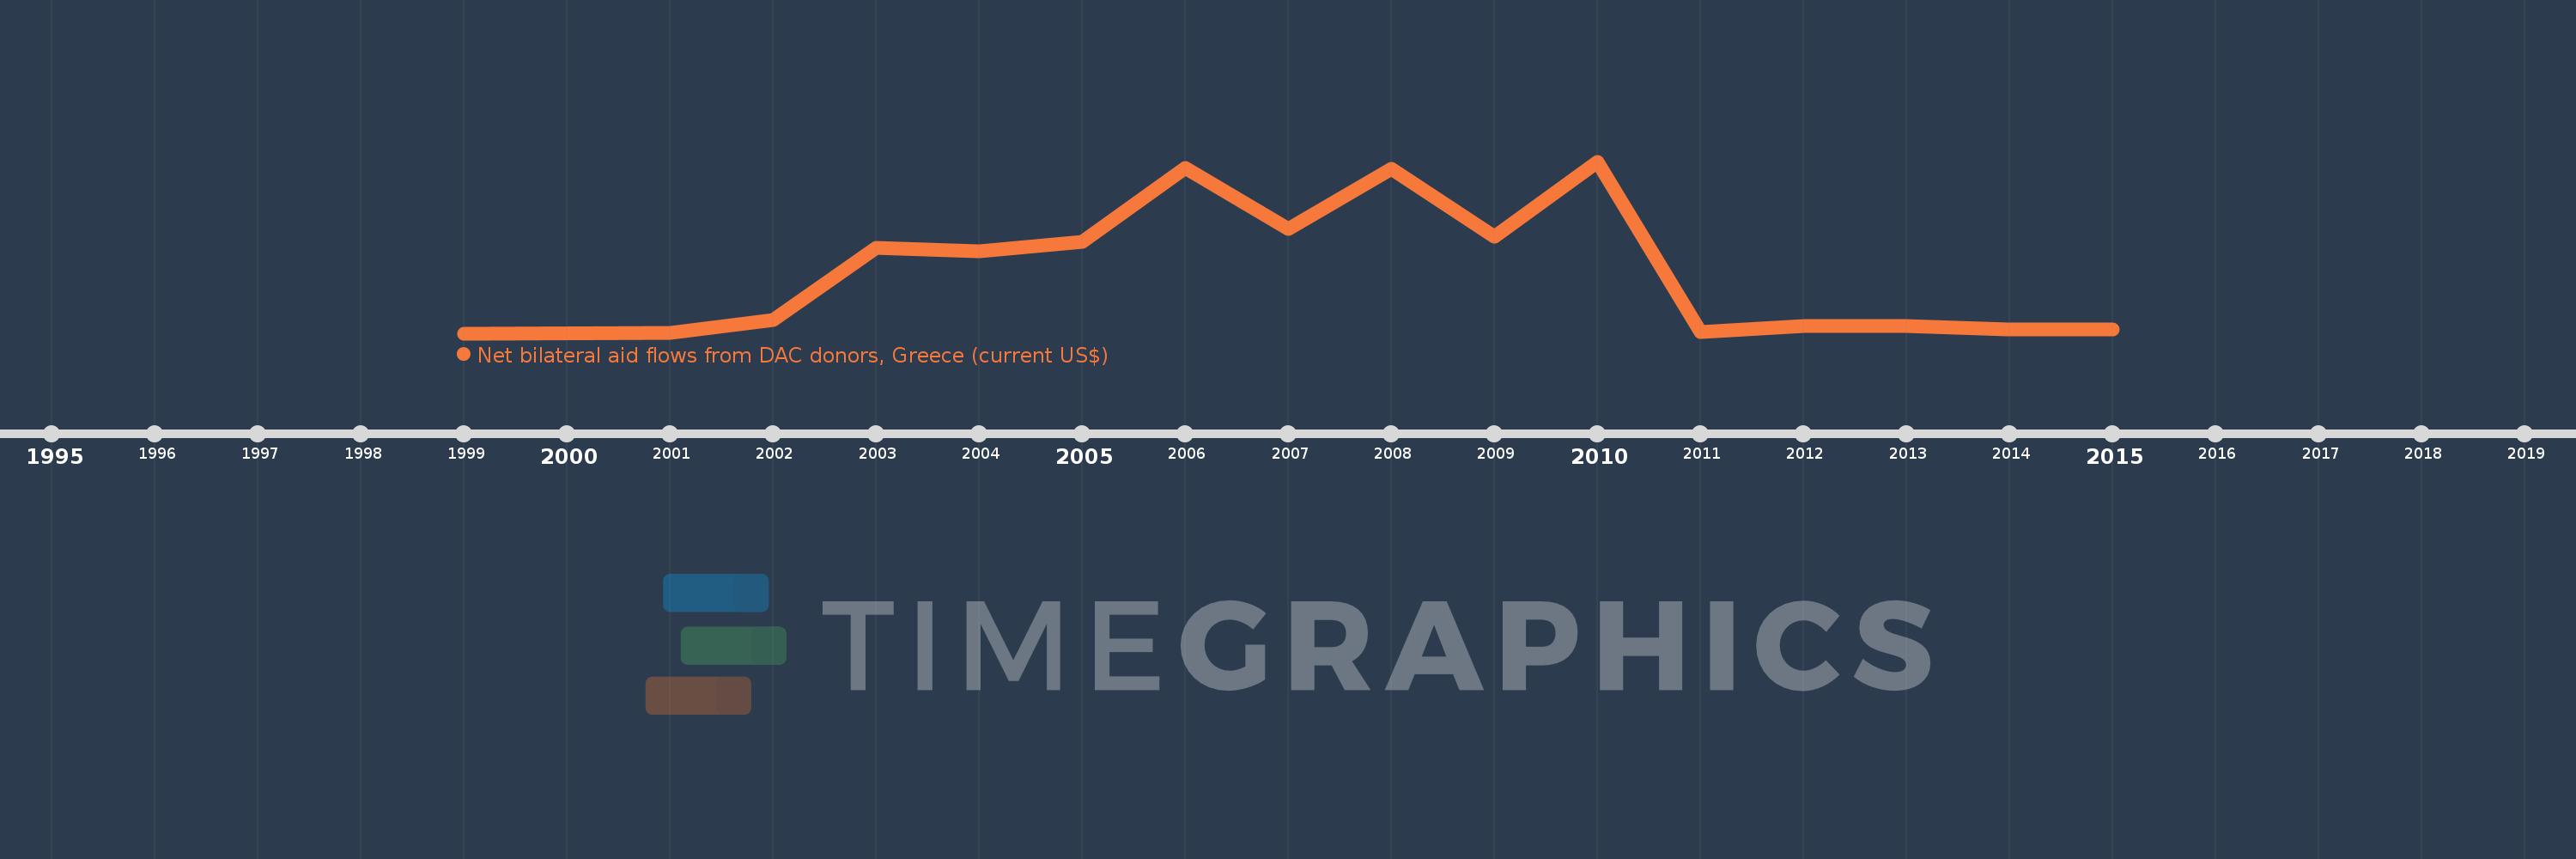
This timeline shows a graph from 1999 to 2015 of Afghanistan. No data until 1998. Number of actual observations by date: 16.
Source name:
World Development Indicators
Source organization:
Development Assistance Committee of the Organisation for Economic Co-operation and Development, Geographical Distribution of Financial Flows to Developing Countries, Development Co-operation Report, and International Development Statistics database. Data are available online at: www.oecd.org/dac/stats/idsonline.
Categories, topics:
Aid Effectiveness
Last updated:
apr 23, 2017
Indicators value changes by year
Meaning:
6.542 mln
Minimum:
20.0K
jan 1, 1999
Maximum:
17.97 mln
jan 1, 2010
At the date of observation
Value
Absolute change
Change from the previous value
jan 1, 1999
20.0K
+20.0K
0.0%
jan 1, 2001
60.0K
+40.0K
200.0%
jan 1, 2002
1.38 mln
+1.32 mln
2.2K%
jan 1, 2003
8.95 mln
+7.57 mln
548.55%
jan 1, 2004
8.61 mln
-340.0K
-3.8%
jan 1, 2005
9.61 mln
+1000.0K
11.61%
jan 1, 2006
17.28 mln
+7.67 mln
79.81%
jan 1, 2007
10.91 mln
-6.37 mln
-36.86%
jan 1, 2008
17.25 mln
+6.34 mln
58.11%
jan 1, 2009
10.13 mln
-7.12 mln
-41.28%
jan 1, 2010
17.97 mln
+7.84 mln
77.39%
jan 1, 2011
140.0K
-17.83 mln
-99.22%
jan 1, 2012
770.0K
+630.0K
450.0%
jan 1, 2013
770.0K
0.0
0.0%
jan 1, 2014
420.0K
-350.0K
-45.45%
jan 1, 2015
400.0K
-20.0K
-4.76%
Ranking of countries by current statistics by years
