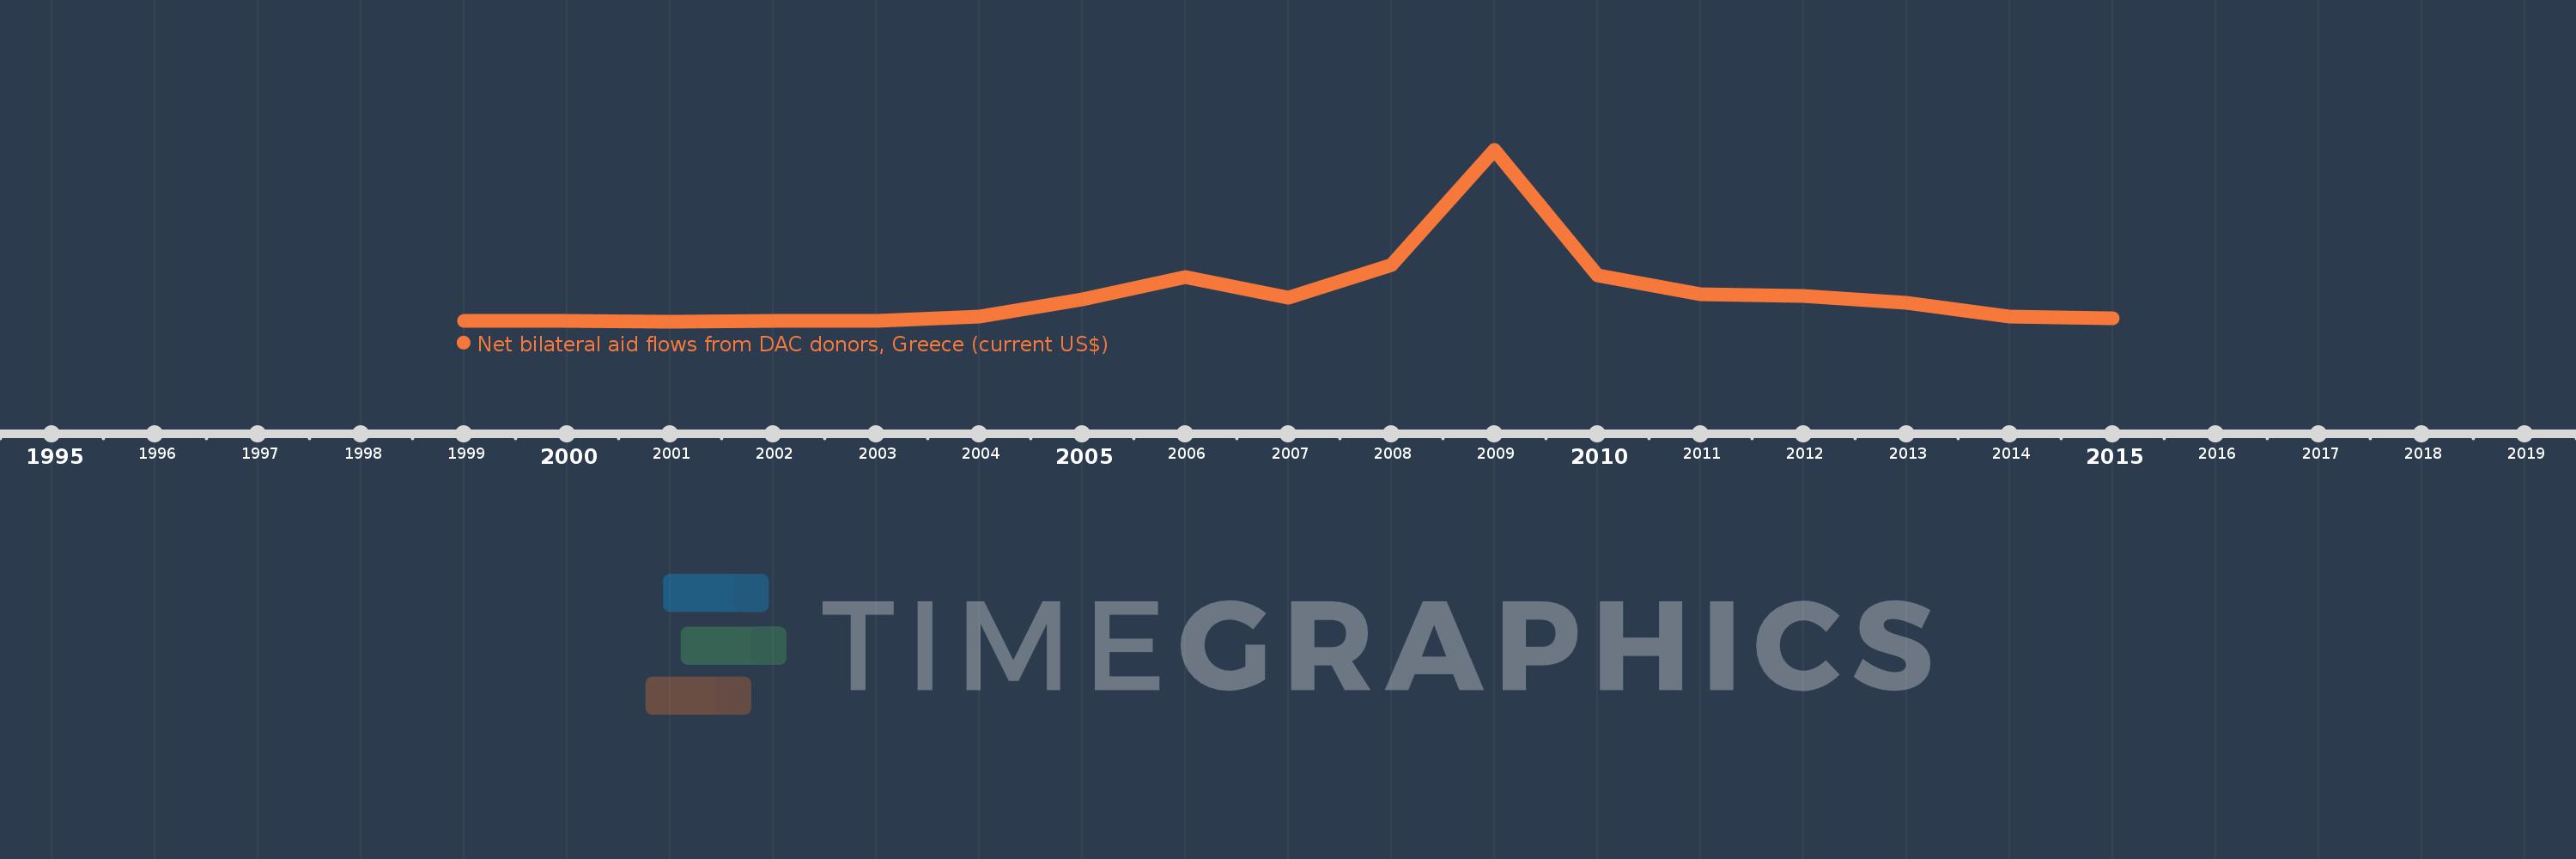
This timeline shows a graph from 1999 to 2015 of Zimbabwe. No data until 1998. Number of actual observations by date: 17.
Source name:
World Development Indicators
Source organization:
Development Assistance Committee of the Organisation for Economic Co-operation and Development, Geographical Distribution of Financial Flows to Developing Countries, Development Co-operation Report, and International Development Statistics database. Data are available online at: www.oecd.org/dac/stats/idsonline.
Categories, topics:
Aid Effectiveness
Last updated:
apr 23, 2017
Indicators value changes by year
Meaning:
272.353K
Minimum:
10.0K
jan 1, 2001
Maximum:
1.68 mln
jan 1, 2009
At the date of observation
Value
Absolute change
Change from the previous value
jan 1, 1999
20.0K
+20.0K
0.0%
jan 1, 2000
20.0K
0.0
0.0%
jan 1, 2001
10.0K
-10.0K
-50.0%
jan 1, 2002
20.0K
+10.0K
100.0%
jan 1, 2003
20.0K
0.0
0.0%
jan 1, 2004
60.0K
+40.0K
200.0%
jan 1, 2005
230.0K
+170.0K
283.33%
jan 1, 2006
450.0K
+220.0K
95.65%
jan 1, 2007
250.0K
-200.0K
-44.44%
jan 1, 2008
560.0K
+310.0K
124.0%
jan 1, 2009
1.68 mln
+1.12 mln
200.0%
jan 1, 2010
460.0K
-1.22 mln
-72.62%
jan 1, 2011
280.0K
-180.0K
-39.13%
jan 1, 2012
260.0K
-20.0K
-7.14%
jan 1, 2013
200.0K
-60.0K
-23.08%
jan 1, 2014
60.0K
-140.0K
-70.0%
jan 1, 2015
50.0K
-10.0K
-16.67%
Ranking of countries by current statistics by years
