30
/
AIzaSyAYiBZKx7MnpbEhh9jyipgxe19OcubqV5w
April 1, 2024
59565
Sub-Saharan Africa (excluding high income)
SSA
false
2
1
Bound rate, simple mean, all products (%)
2013,2011,2010,2009,2008,2007,2006,2005,2004,2003,2002,2001,2000,1999,1998,1997
Download
Global statistics library →Sub-Saharan Africa (excluding high income) →

Bound rate, simple mean, all products (%)

This statistics in other country:

AlbaniaAngolaAntigua and BarbudaArgentinaArmeniaAustraliaAustriaBahrainBangladeshBarbadosBelgiumBelizeBeninBoliviaBotswanaBrazilBrunei DarussalamBulgariaBurkina FasoBurundiCabo VerdeCambodiaCameroonCanadaCentral African RepublicChadChileChinaColombiaCongo, Dem. Rep.Congo, Rep.Costa RicaCote d'IvoireCubaCyprusCzech RepublicDenmarkDjiboutiDominicaDominican RepublicEast Asia & Pacific (excluding high income)EcuadorEgypt, Arab Rep.El SalvadorEstoniaEurope & Central Asia (excluding high income)European UnionFijiFinlandFranceGabonGambia, TheGeorgiaGermanyGhanaGreeceGrenadaGuatemalaGuineaGuinea-BissauGuyanaHaitiHigh incomeHondurasHong Kong SAR, ChinaHungaryIcelandIndiaIndonesiaIrelandIsraelItalyJamaicaJapanJordanKenyaKorea, Rep.KuwaitKyrgyz RepublicLatin America & Caribbean (excluding high income)LatviaLesothoLithuaniaLow & middle incomeLow incomeLower middle incomeLuxembourgMacao SAR, ChinaMacedonia, FYRMadagascarMalawiMalaysiaMaldivesMaliMaltaMauritaniaMauritiusMexicoMiddle East & North Africa (excluding high income)Middle incomeMoldovaMongoliaMoroccoMozambiqueMyanmarNamibiaNepalNetherlandsNew ZealandNicaraguaNigerNigeriaNorwayOECD membersOmanPakistanPanamaPapua New GuineaParaguayPeruPhilippinesPolandPortugalQatarRomaniaRwandaSaudi ArabiaSenegalSierra LeoneSingaporeSlovak RepublicSloveniaSolomon IslandsSouth AfricaSouth AsiaSpainSri LankaSt. Kitts and NevisSt. LuciaSt. Vincent and the GrenadinesSub-Saharan Africa (excluding high income)SurinameSwazilandSwedenSwitzerlandTanzaniaThailandTogoTongaTrinidad and TobagoTunisiaTurkeyUgandaUkraineUnited Arab EmiratesUnited KingdomUnited StatesUpper middle incomeUruguayVenezuela, RBVietnamWorldZambiaZimbabwe

Timeline:

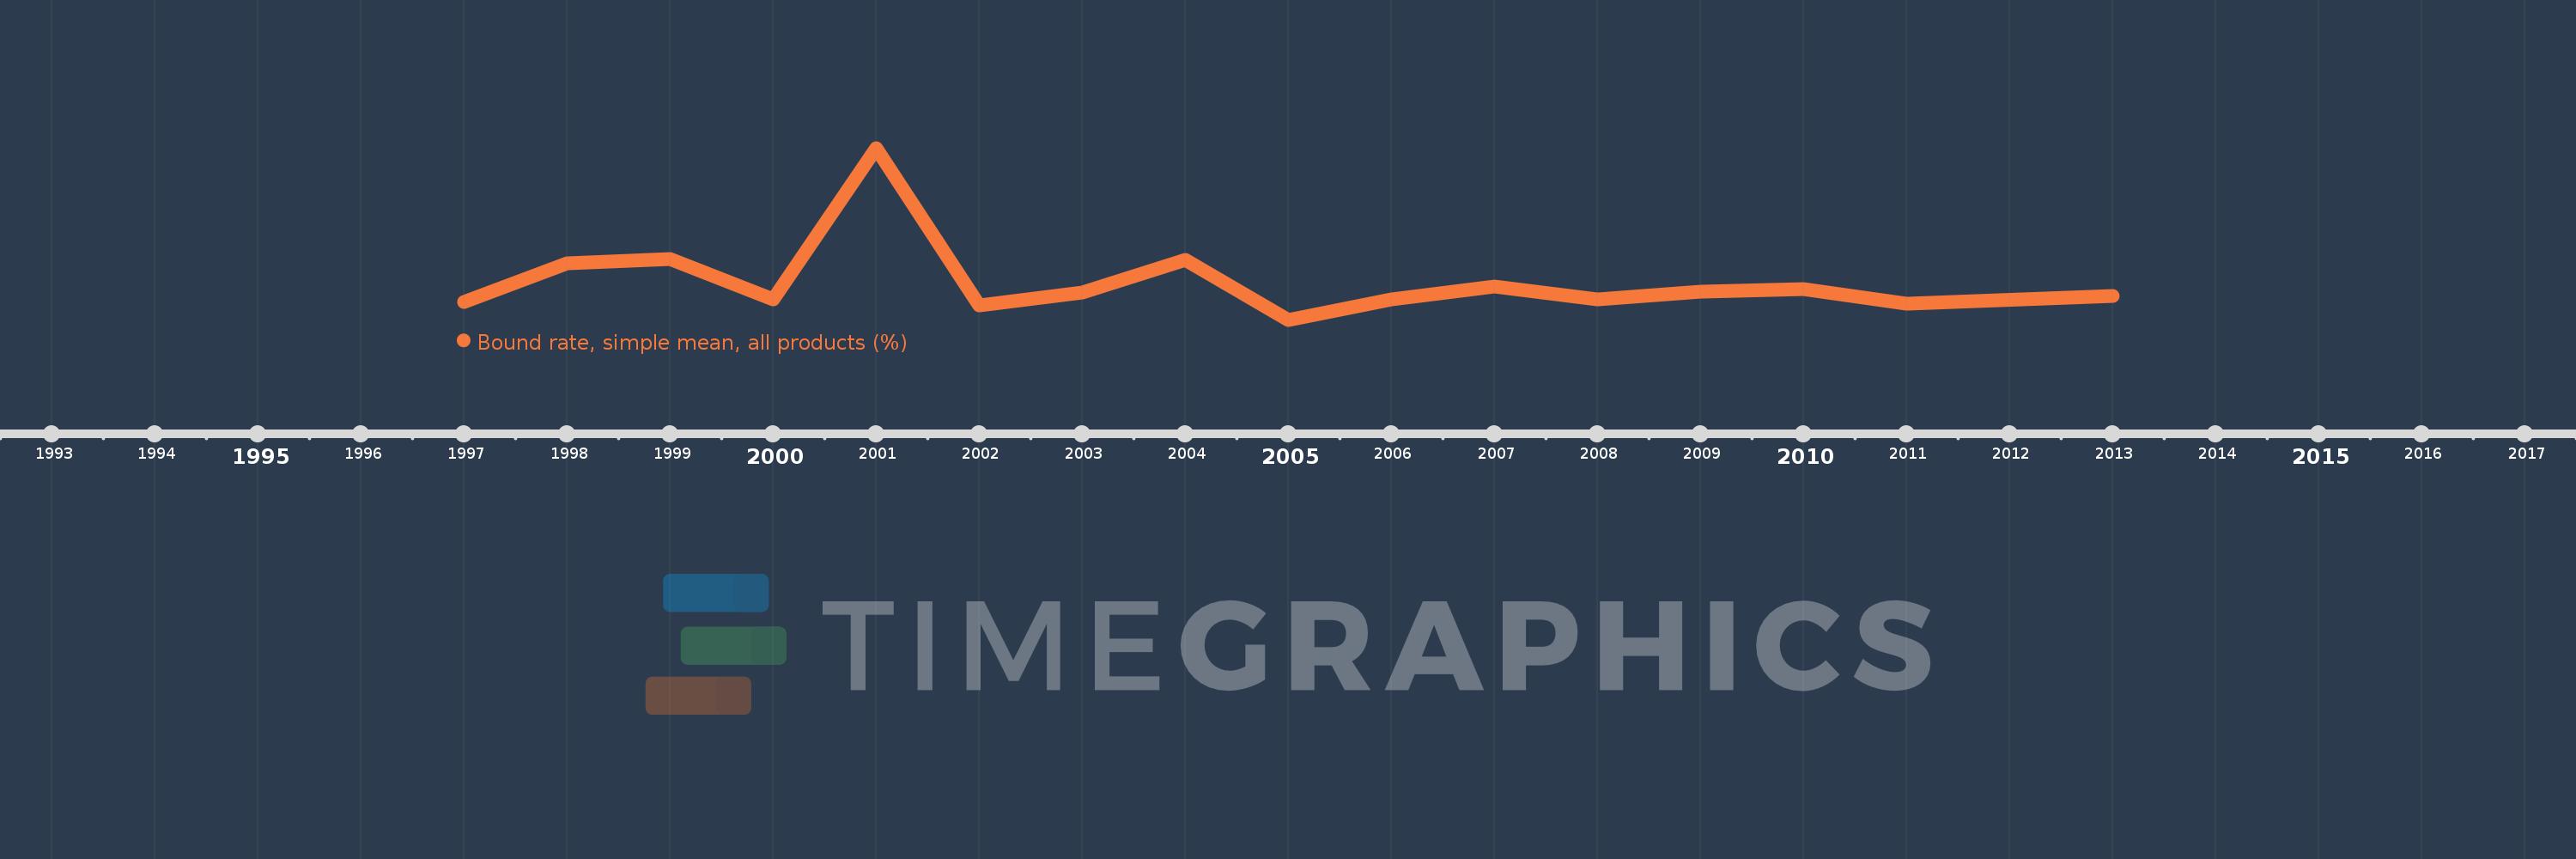
This timeline shows a graph from 1997 to 2013 of Sub-Saharan Africa (excluding high income). No data until 1996. Number of actual observations by date: 16.

Source name:

World Development Indicators

Source organization:

World Bank staff estimates using the World Integrated Trade Solution system, based on data from World Trade Organization.

Categories, topics:

Private Sector, Trade

Last updated:

apr 23, 2017

Indicators value changes by year

Meaning:
50.828
Minimum:
36.94
jan 1, 2005
Maximum:
100.38
jan 1, 2001
At the date of observation
Value
Absolute change
Change from the previous value
jan 1, 1997
43.53
+43.53
0.0%
jan 1, 1998
57.75
+14.22
32.67%
jan 1, 1999
59.43
+1.68
2.91%
jan 1, 2000
44.3
-15.13
-25.46%
jan 1, 2001
100.38
+56.08
126.59%
jan 1, 2002
42.22
-58.16
-57.94%
jan 1, 2003
47.11
+4.89
11.58%
jan 1, 2004
59.07
+11.96
25.39%
jan 1, 2005
36.94
-22.13
-37.46%
jan 1, 2006
44.37
+7.43
20.11%
jan 1, 2007
49.32
+4.95
11.16%
jan 1, 2008
44.5
-4.82
-9.77%
jan 1, 2009
47.18
+2.68
6.02%
jan 1, 2010
48.4
+1.22
2.59%
jan 1, 2011
42.89
-5.51
-11.38%
jan 1, 2013
45.85
+2.96
6.9%

Ranking of countries by current statistics by years