30
/
AIzaSyAYiBZKx7MnpbEhh9jyipgxe19OcubqV5w
April 1, 2024
48768
Middle East & North Africa (excluding high income)
MNA
false
2
1
Bound rate, simple mean, all products (%)
2013,2010,2009,2008,2007,2006,2005,2004,2003,2002,2001,1999,1998
Download
Global statistics library →Middle East & North Africa (excluding high income) →

Bound rate, simple mean, all products (%)

This statistics in other country:

AlbaniaAngolaAntigua and BarbudaArgentinaArmeniaAustraliaAustriaBahrainBangladeshBarbadosBelgiumBelizeBeninBoliviaBotswanaBrazilBrunei DarussalamBulgariaBurkina FasoBurundiCabo VerdeCambodiaCameroonCanadaCentral African RepublicChadChileChinaColombiaCongo, Dem. Rep.Congo, Rep.Costa RicaCote d'IvoireCubaCyprusCzech RepublicDenmarkDjiboutiDominicaDominican RepublicEast Asia & Pacific (excluding high income)EcuadorEgypt, Arab Rep.El SalvadorEstoniaEurope & Central Asia (excluding high income)European UnionFijiFinlandFranceGabonGambia, TheGeorgiaGermanyGhanaGreeceGrenadaGuatemalaGuineaGuinea-BissauGuyanaHaitiHigh incomeHondurasHong Kong SAR, ChinaHungaryIcelandIndiaIndonesiaIrelandIsraelItalyJamaicaJapanJordanKenyaKorea, Rep.KuwaitKyrgyz RepublicLatin America & Caribbean (excluding high income)LatviaLesothoLithuaniaLow & middle incomeLow incomeLower middle incomeLuxembourgMacao SAR, ChinaMacedonia, FYRMadagascarMalawiMalaysiaMaldivesMaliMaltaMauritaniaMauritiusMexicoMiddle East & North Africa (excluding high income)Middle incomeMoldovaMongoliaMoroccoMozambiqueMyanmarNamibiaNepalNetherlandsNew ZealandNicaraguaNigerNigeriaNorwayOECD membersOmanPakistanPanamaPapua New GuineaParaguayPeruPhilippinesPolandPortugalQatarRomaniaRwandaSaudi ArabiaSenegalSierra LeoneSingaporeSlovak RepublicSloveniaSolomon IslandsSouth AfricaSouth AsiaSpainSri LankaSt. Kitts and NevisSt. LuciaSt. Vincent and the GrenadinesSub-Saharan Africa (excluding high income)SurinameSwazilandSwedenSwitzerlandTanzaniaThailandTogoTongaTrinidad and TobagoTunisiaTurkeyUgandaUkraineUnited Arab EmiratesUnited KingdomUnited StatesUpper middle incomeUruguayVenezuela, RBVietnamWorldZambiaZimbabwe

Timeline:

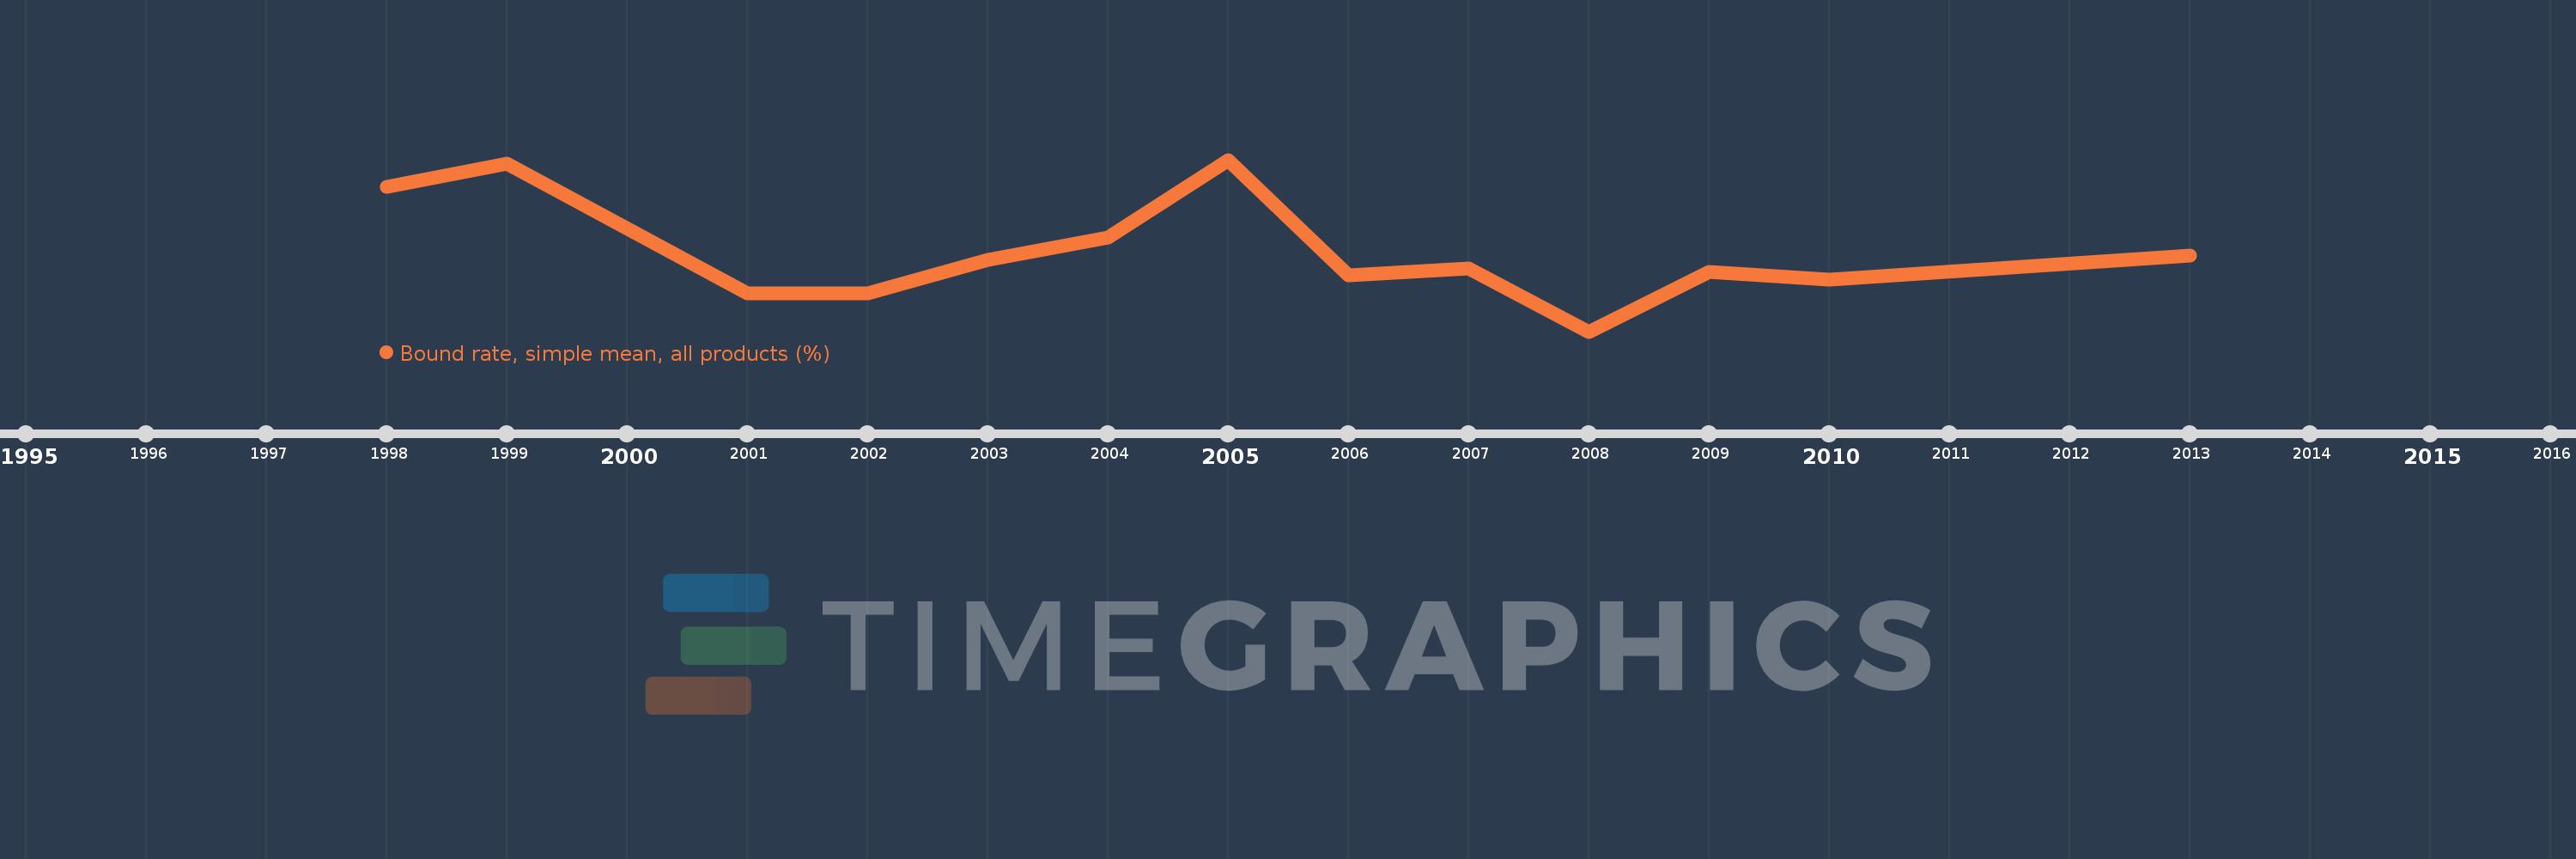
This timeline shows a graph from 1998 to 2013 of Middle East & North Africa (excluding high income). No data until 1997. Number of actual observations by date: 13.

Source name:

World Development Indicators

Source organization:

World Bank staff estimates using the World Integrated Trade Solution system, based on data from World Trade Organization.

Categories, topics:

Private Sector, Trade

Last updated:

apr 23, 2017

Indicators value changes by year

Meaning:
33.625
Minimum:
24.31
jan 1, 2008
Maximum:
44.46
jan 1, 2005
At the date of observation
Value
Absolute change
Change from the previous value
jan 1, 1998
41.26
+41.26
0.0%
jan 1, 1999
43.99
+2.73
6.62%
jan 1, 2001
28.8
-15.19
-34.53%
jan 1, 2002
28.8
0.0
0.0%
jan 1, 2003
32.72
+3.92
13.61%
jan 1, 2004
35.31
+2.59
7.92%
jan 1, 2005
44.46
+9.15
25.91%
jan 1, 2006
30.87
-13.59
-30.57%
jan 1, 2007
31.75
+0.88
2.85%
jan 1, 2008
24.31
-7.44
-23.43%
jan 1, 2009
31.29
+6.98
28.71%
jan 1, 2010
30.36
-0.93
-2.97%
jan 1, 2013
33.21
+2.85
9.39%

Ranking of countries by current statistics by years