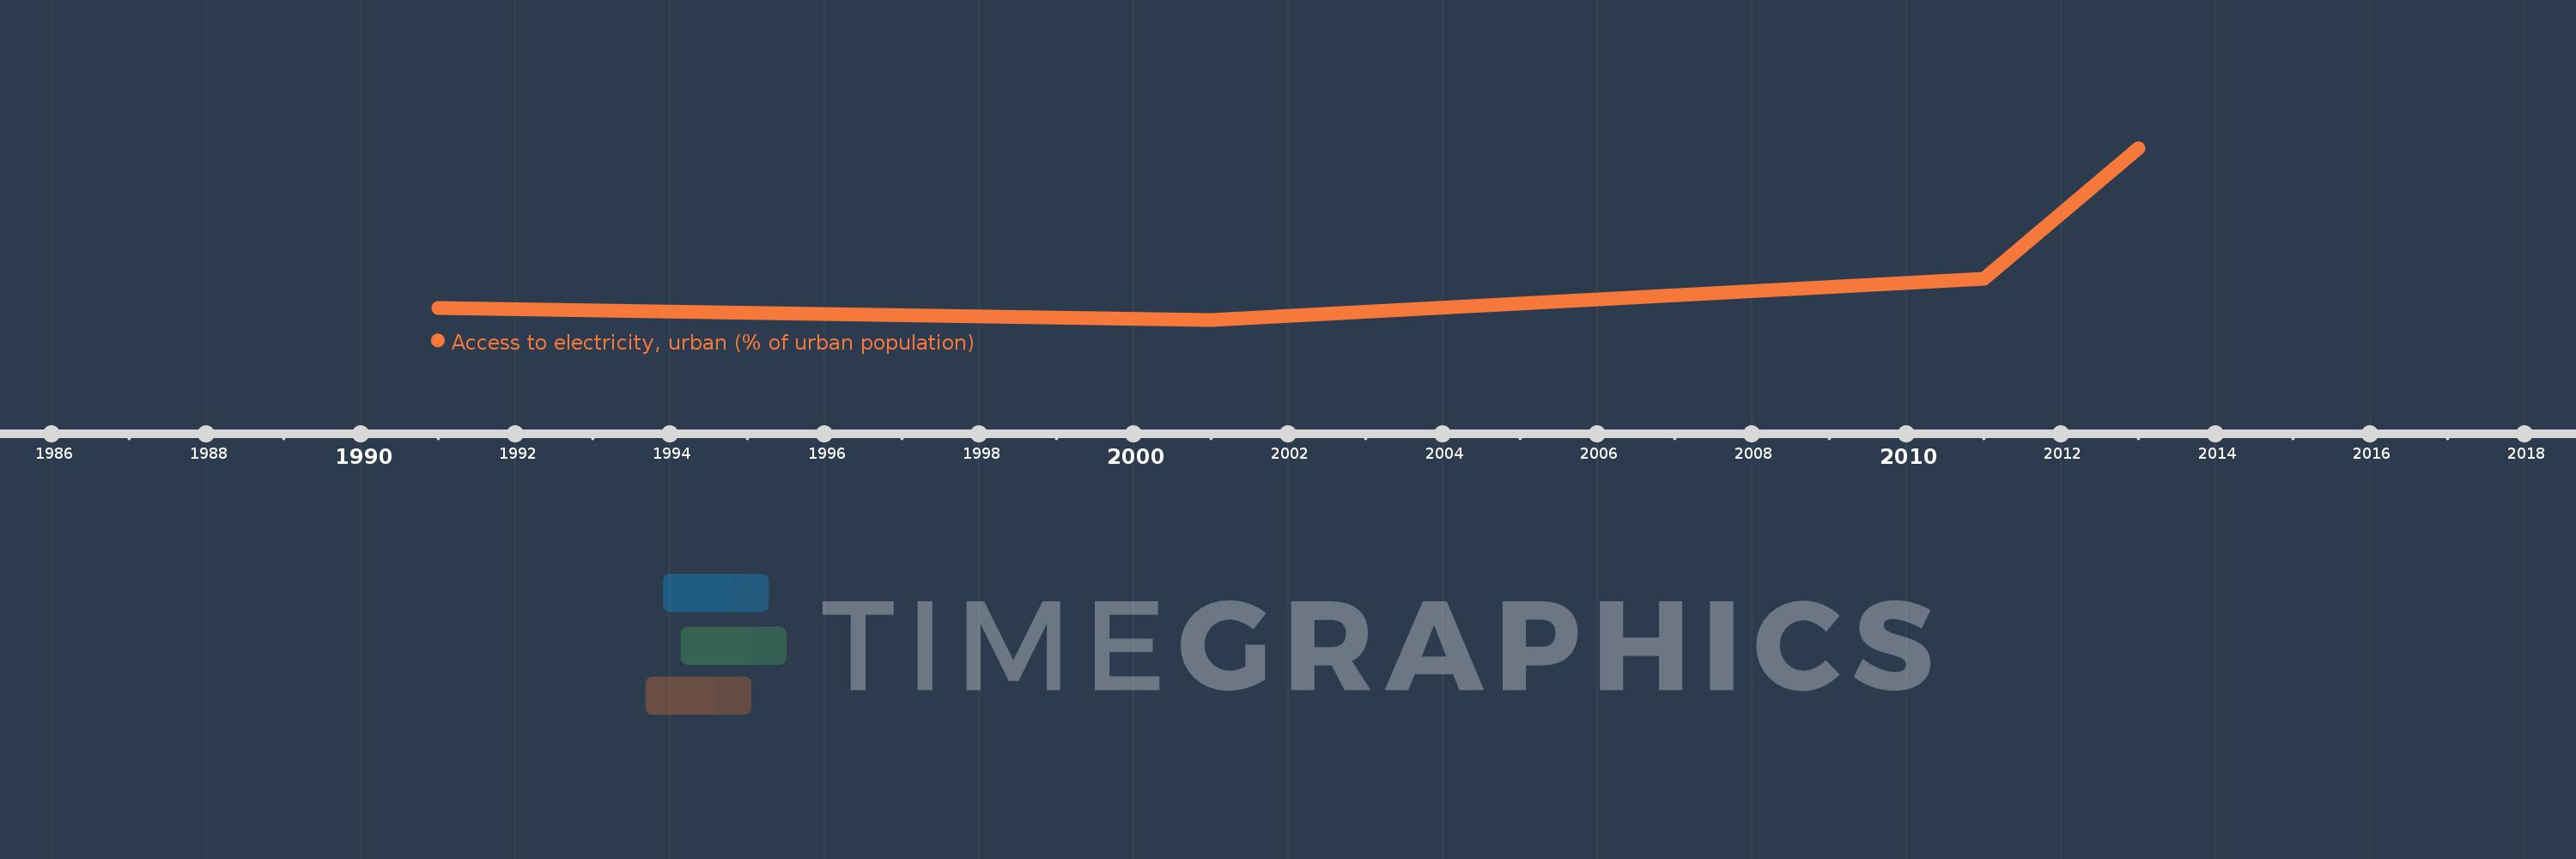
This timeline shows a graph from 1991 to 2013 of Sub-Saharan Africa (excluding high income). No data until 1990. Number of actual observations by date: 4.
Source name:
World Development Indicators
Source organization:
World Bank, Sustainable Energy for All (SE4ALL) database from World Bank, Global Electrification database.
Categories, topics:
Energy & Mining, Urban Development
Last updated:
apr 23, 2017
Indicators value changes by year
Meaning:
63.977
Minimum:
60.269
jan 1, 2001
Maximum:
71.608
jan 1, 2013
At the date of observation
Value
Absolute change
Change from the previous value
jan 1, 1991
61.044
+61.044
0.0%
jan 1, 2001
60.269
-0.774
-1.27%
jan 1, 2011
62.988
+2.718
4.51%
jan 1, 2013
71.608
+8.62
13.69%
Ranking of countries by current statistics by years
