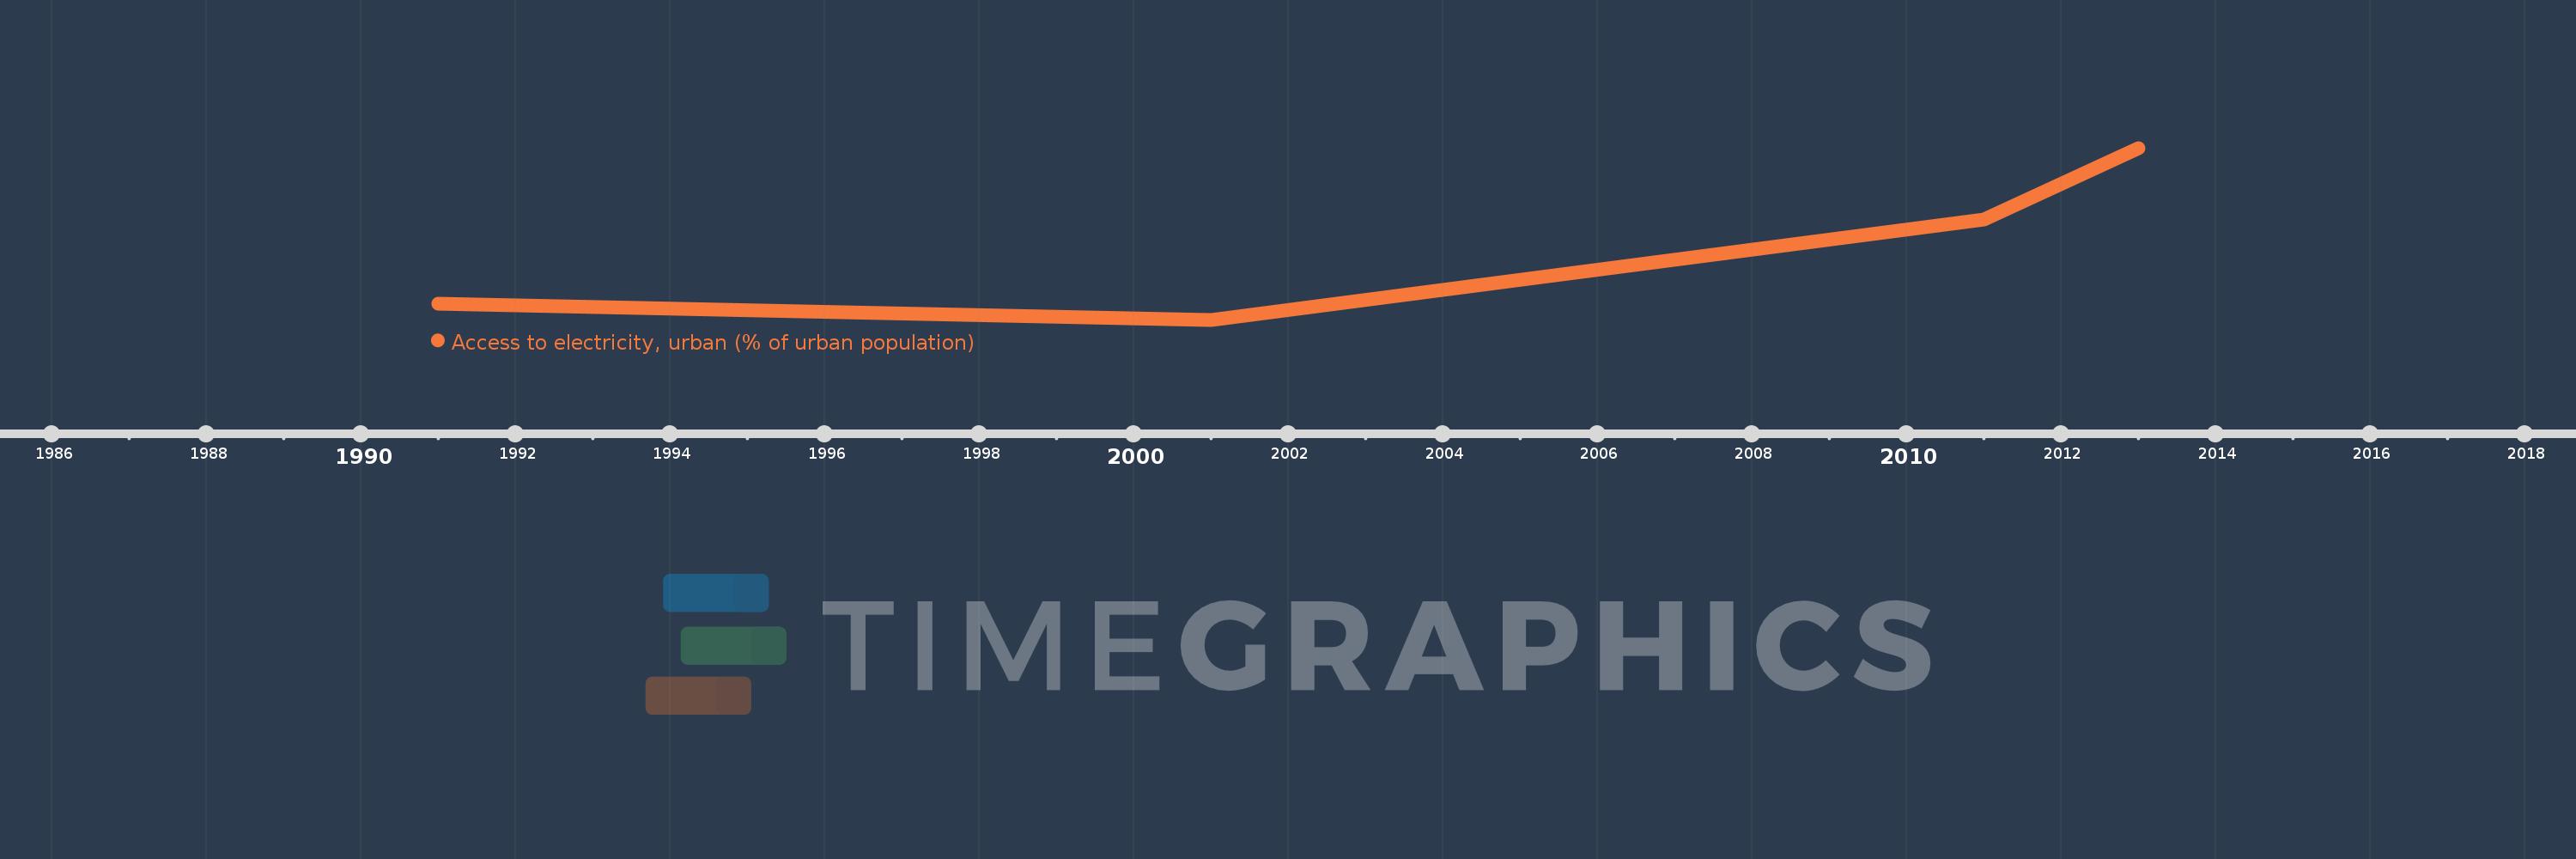
This timeline shows a graph from 1991 to 2013 of Least developed countries: UN classification. No data until 1990. Number of actual observations by date: 4.
Source name:
World Development Indicators
Source organization:
World Bank, Sustainable Energy for All (SE4ALL) database from World Bank, Global Electrification database.
Categories, topics:
Energy & Mining, Urban Development
Last updated:
apr 23, 2017
Indicators value changes by year
Meaning:
62.648
Minimum:
57.56
jan 1, 2001
Maximum:
69.712
jan 1, 2013
At the date of observation
Value
Absolute change
Change from the previous value
jan 1, 1991
58.681
+58.681
0.0%
jan 1, 2001
57.56
-1.121
-1.91%
jan 1, 2011
64.639
+7.079
12.3%
jan 1, 2013
69.712
+5.073
7.85%
Ranking of countries by current statistics by years
