29
/
en
AIzaSyAYiBZKx7MnpbEhh9jyipgxe19OcubqV5w
April 1, 2024
57593
South Asia
SAS
false
2
1
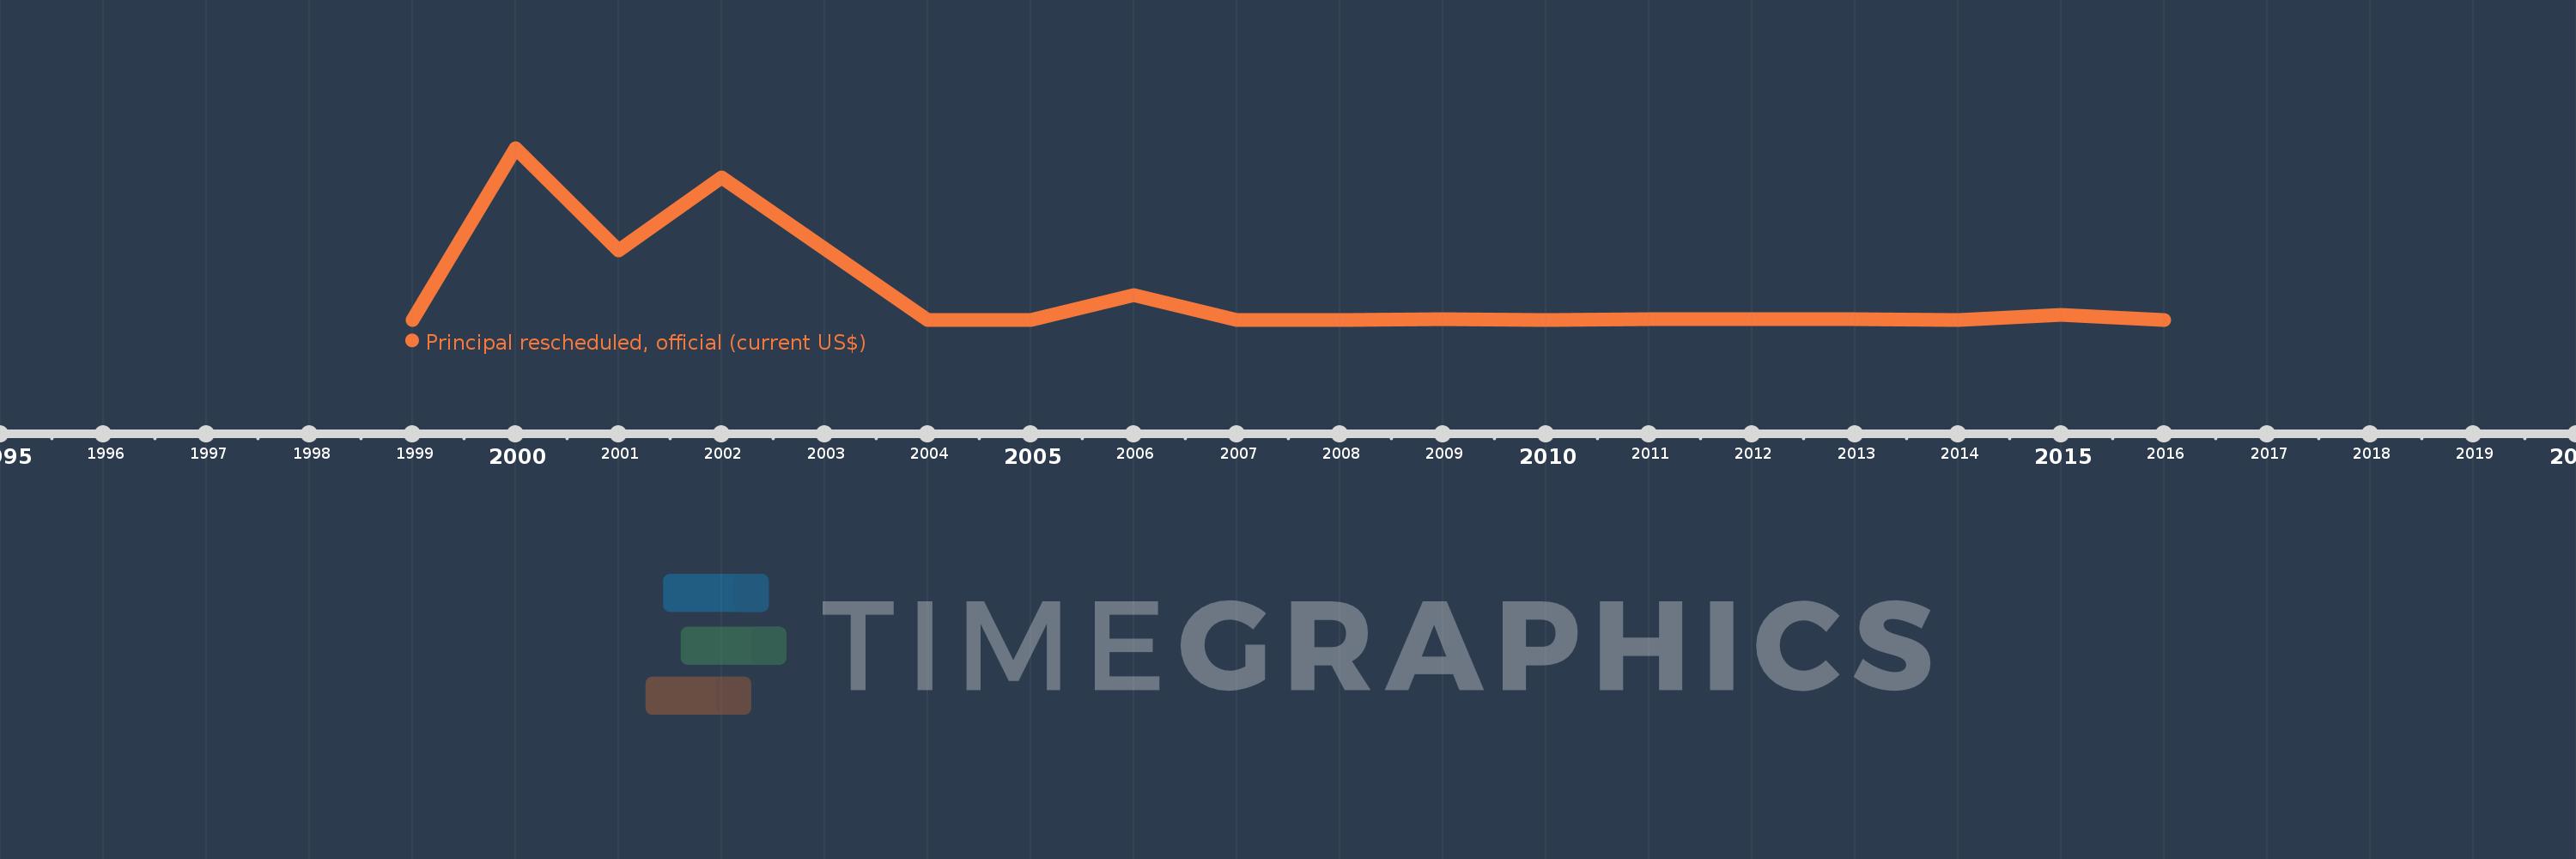
Principal rescheduled, official (current US$)
2016,2015,2014,2013,2011,2010,2009,2008,2007,2006,2005,2004,2002,2001,2000,1999
This statistics in other country:
Timeline:
This timeline shows a graph from 1999 to 2016 of South Asia. No data until 1998. Number of actual observations by date: 16.
Source name:
World Development Indicators
Source organization:
World Bank, International Debt Statistics.
Categories, topics:
External Debt
Last updated:
apr 23, 2017
Indicators value changes by year
Maximum:
1.447 bln
jan 1, 2000
At the date of observation
Value
Absolute change
Change from previous value
jan 1, 2000
1.447 bln
+1.447 bln
%
jan 1, 2001
582.766 mln
-864.642 mln
-59.74%
jan 1, 2002
1.202 bln
+619.643 mln
106.33%
jan 1, 2004
496.0K
-1.202 bln
-99.96%
jan 1, 2005
0.0
-496.0K
-100.0%
jan 1, 2006
210.506 mln
+210.506 mln
%
jan 1, 2007
0.0
-210.506 mln
-100.0%
jan 1, 2009
3.579 mln
+3.579 mln
%
jan 1, 2010
0.0
-3.579 mln
-100.0%
jan 1, 2011
1.691 mln
+1.691 mln
%
jan 1, 2013
6.546 mln
+4.855 mln
287.11%
jan 1, 2014
0.0
-6.546 mln
-100.0%
jan 1, 2015
41.863 mln
+41.863 mln
%
jan 1, 2016
0.0
-41.863 mln
-100.0%
Ranking of countries by current statistics by years


Comments: