29
/
en
AIzaSyAYiBZKx7MnpbEhh9jyipgxe19OcubqV5w
April 1, 2024
147385
Guinea-Bissau
GNB
true
2
1
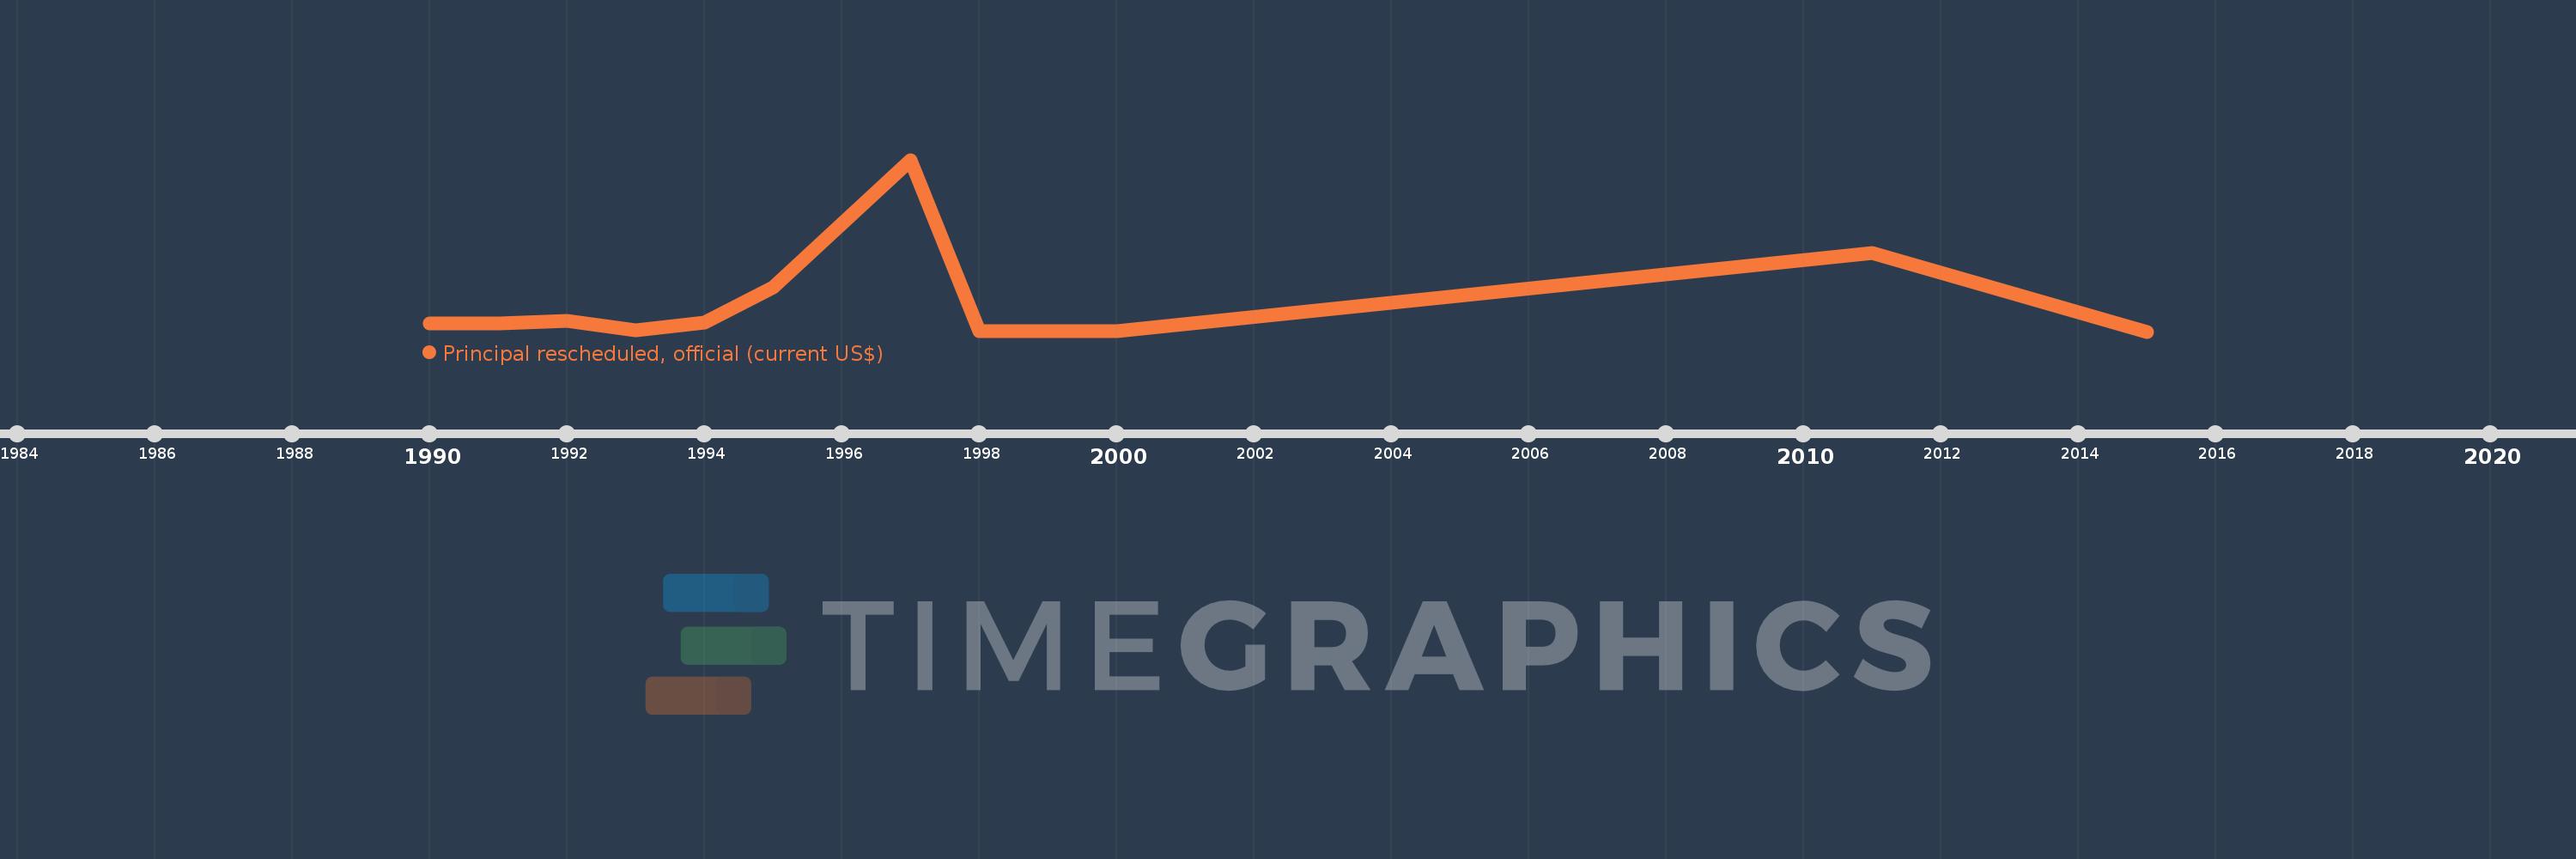
Principal rescheduled, official (current US$)
2015,2011,2000,1999,1998,1997,1995,1994,1993,1992,1991,1990
This statistics in other country:
Timeline:
This timeline shows a graph from 1990 to 2015 of Guinea-Bissau. No data until 1989. Number of actual observations by date: 12.
Source name:
World Development Indicators
Source organization:
World Bank, International Debt Statistics.
Categories, topics:
External Debt
Last updated:
apr 23, 2017
Indicators value changes by year
Maximum:
83.265 mln
jan 1, 1997
At the date of observation
Value
Absolute change
Change from previous value
jan 1, 1990
3.893 mln
+3.893 mln
0.0%
jan 1, 1991
3.825 mln
-68.0K
-1.75%
jan 1, 1992
5.165 mln
+1.34 mln
35.03%
jan 1, 1993
603.0K
-4.562 mln
-88.33%
jan 1, 1994
4.197 mln
+3.594 mln
596.02%
jan 1, 1995
21.518 mln
+17.321 mln
412.7%
jan 1, 1997
83.265 mln
+61.747 mln
286.96%
jan 1, 1998
308.0K
-82.957 mln
-99.63%
jan 1, 1999
284.0K
-24.0K
-7.79%
jan 1, 2000
76.0K
-208.0K
-73.24%
jan 1, 2011
38.244 mln
+38.168 mln
50.22K%
jan 1, 2015
0.0
-38.244 mln
-100.0%
Ranking of countries by current statistics by years


Comments: