29
/
en
AIzaSyAYiBZKx7MnpbEhh9jyipgxe19OcubqV5w
April 1, 2024
55658
Pre-demographic dividend
PRE
false
2
1
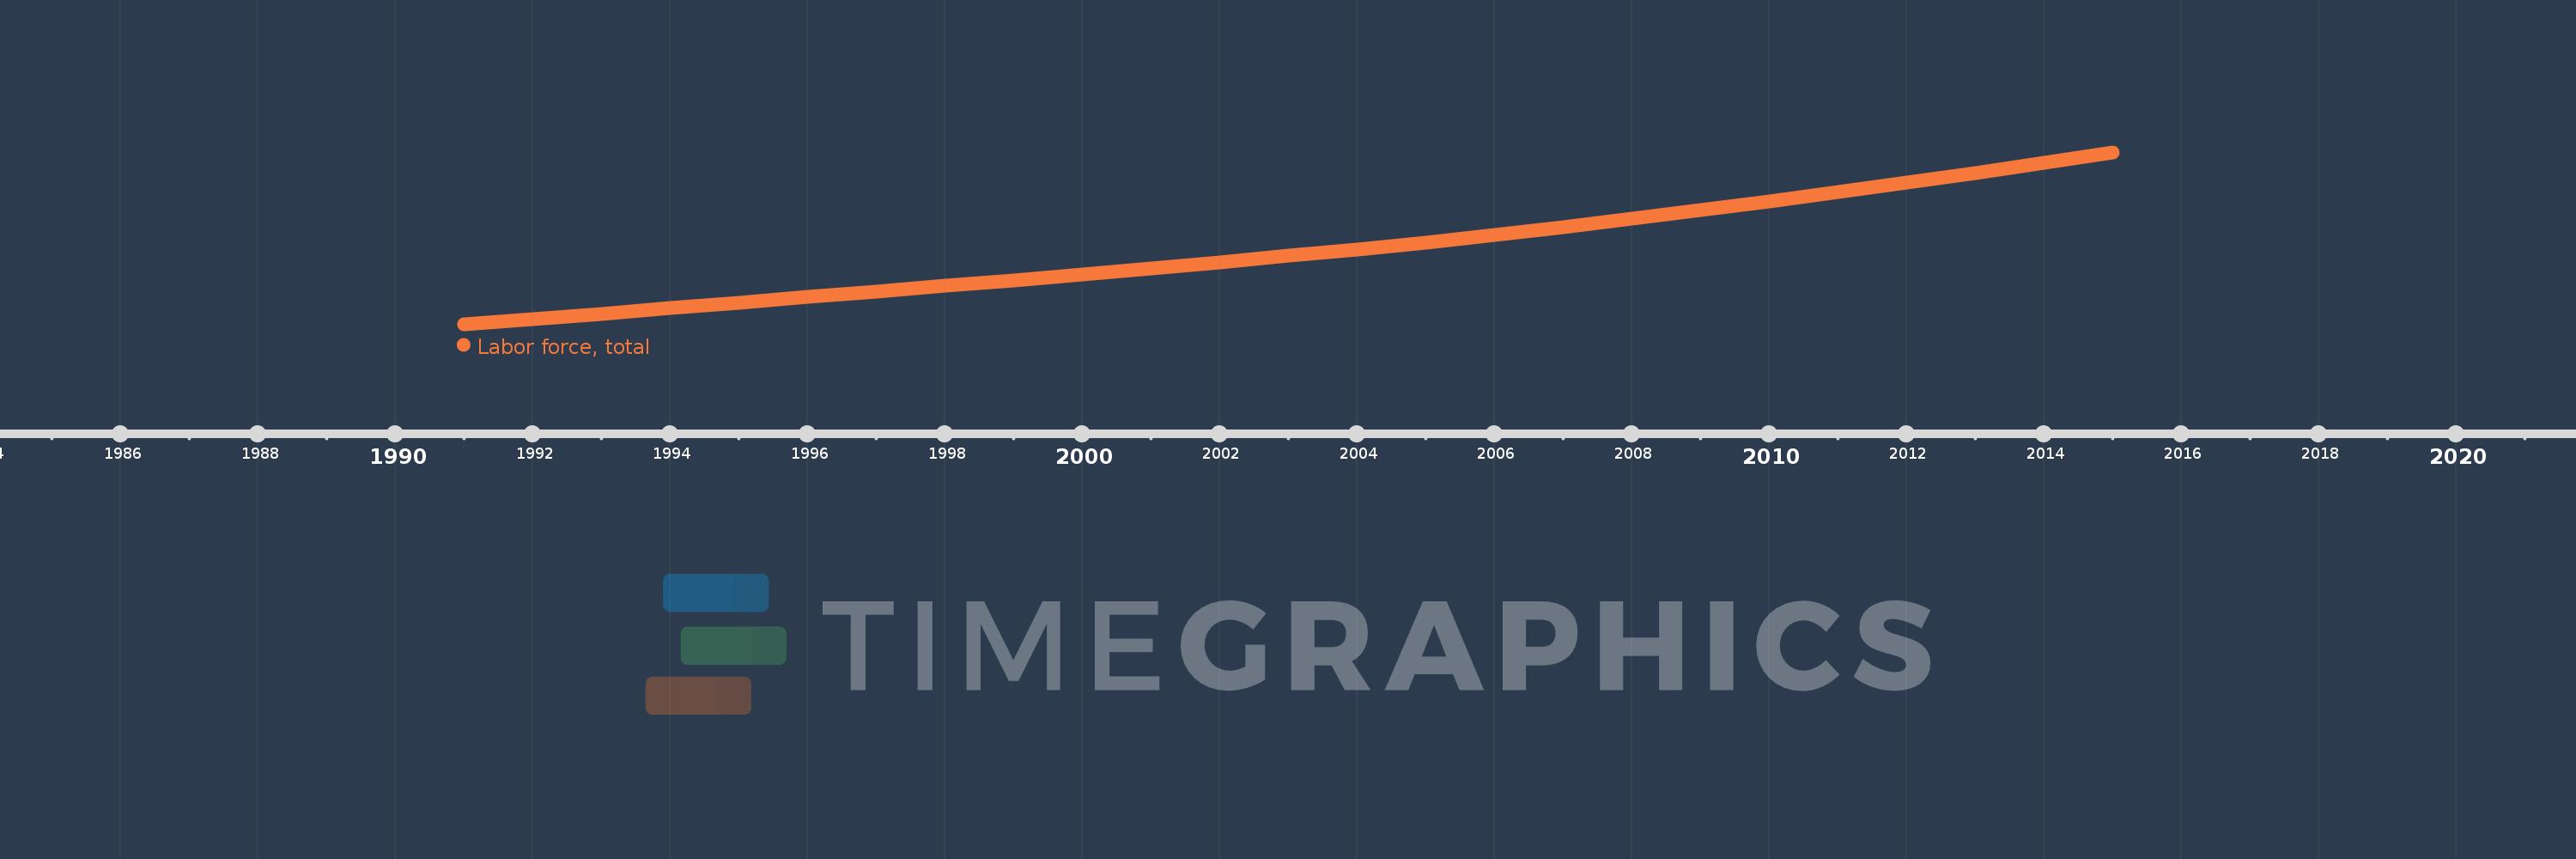
Labor force, total
2015,2014,2013,2012,2011,2010,2009,2008,2007,2006,2005,2004,2003,2002,2001,2000,1999,1998,1997,1996,1995,1994,1993,1992,1991
This statistics in other country:
AfghanistanAlbaniaAlgeriaAngolaArab WorldArgentinaArmeniaAustraliaAustriaAzerbaijanBahamas, TheBahrainBangladeshBarbadosBelarusBelgiumBelizeBeninBhutanBoliviaBosnia and HerzegovinaBotswanaBrazilBrunei DarussalamBulgariaBurkina FasoBurundiCabo VerdeCambodiaCameroonCanadaCaribbean small statesCentral African RepublicCentral Europe and the BalticsChadChannel IslandsChileChinaColombiaComorosCongo, Dem. Rep.Congo, Rep.Costa RicaCote d'IvoireCroatiaCubaCyprusCzech RepublicDenmarkDjiboutiDominican RepublicEarly-demographic dividendEast Asia & PacificEast Asia & Pacific (excluding high income)East Asia & Pacific (IDA & IBRD countries)EcuadorEgypt, Arab Rep.El SalvadorEquatorial GuineaEritreaEstoniaEthiopiaEuro areaEurope & Central AsiaEurope & Central Asia (excluding high income)Europe & Central Asia (IDA & IBRD countries)European UnionFijiFinlandFragile and conflict affected situationsFranceFrench PolynesiaGabonGambia, TheGeorgiaGermanyGhanaGreeceGuamGuatemalaGuineaGuinea-BissauGuyanaHaitiHeavily indebted poor countries (HIPC)High incomeHondurasHong Kong SAR, ChinaHungaryIBRD onlyIcelandIDA & IBRD totalIDA blendIDA onlyIDA totalIndiaIndonesiaIran, Islamic Rep.IraqIrelandIsraelItalyJamaicaJapanJordanKazakhstanKenyaKorea, Dem. People’s Rep.Korea, Rep.KuwaitKyrgyz RepublicLao PDRLate-demographic dividendLatin America & Caribbean Latin America & Caribbean (excluding high income)Latin America & the Caribbean (IDA & IBRD countries)LatviaLeast developed countries: UN classificationLebanonLesothoLiberiaLibyaLithuaniaLow & middle incomeLow incomeLower middle incomeLuxembourgMacao SAR, ChinaMacedonia, FYRMadagascarMalawiMalaysiaMaldivesMaliMaltaMauritaniaMauritiusMexicoMiddle East & North AfricaMiddle East & North Africa (excluding high income)Middle East & North Africa (IDA & IBRD countries)Middle incomeMoldovaMongoliaMontenegroMoroccoMozambiqueMyanmarNamibiaNepalNetherlandsNew CaledoniaNew ZealandNicaraguaNigerNigeriaNorth AmericaNorwayOECD membersOmanOther small statesPacific island small statesPakistanPanamaPapua New GuineaParaguayPeruPhilippinesPolandPortugalPost-demographic dividendPre-demographic dividendPuerto RicoQatarRomaniaRussian FederationRwandaSamoaSao Tome and PrincipeSaudi ArabiaSenegalSerbiaSierra LeoneSingaporeSlovak RepublicSloveniaSmall statesSolomon IslandsSomaliaSouth AfricaSouth AsiaSouth Asia (IDA & IBRD)SpainSri LankaSt. LuciaSt. Vincent and the GrenadinesSub-Saharan Africa Sub-Saharan Africa (excluding high income)Sub-Saharan Africa (IDA & IBRD countries)SudanSurinameSwazilandSwedenSwitzerlandSyrian Arab RepublicTajikistanTanzaniaThailandTimor-LesteTogoTongaTrinidad and TobagoTunisiaTurkeyTurkmenistanUgandaUkraineUnited Arab EmiratesUnited KingdomUnited StatesUpper middle incomeUruguayUzbekistanVanuatuVenezuela, RBVietnamVirgin Islands (U.S.)West Bank and GazaWorldYemen, Rep.ZambiaZimbabwe Timeline:
This timeline shows a graph from 1991 to 2015 of Pre-demographic dividend. No data until 1990. Number of actual observations by date: 25.
Source name:
World Development Indicators
Source organization:
International Labour Organization, using World Bank population estimates.
Categories, topics:
Education, Social Protection & Labor
Last updated:
apr 23, 2017
Indicators value changes by year
Minimum:
148.527 mln
jan 1, 1991
Maximum:
304.421 mln
jan 1, 2015
At the date of observation
Value
Absolute change
Change from previous value
jan 1, 1991
148.527 mln
+148.527 mln
0.0%
jan 1, 1992
152.869 mln
+4.342 mln
2.92%
jan 1, 1993
157.704 mln
+4.835 mln
3.16%
jan 1, 1994
162.904 mln
+5.2 mln
3.3%
jan 1, 1995
168.252 mln
+5.348 mln
3.28%
jan 1, 1996
173.647 mln
+5.395 mln
3.21%
jan 1, 1997
178.397 mln
+4.75 mln
2.74%
jan 1, 1998
183.213 mln
+4.815 mln
2.7%
jan 1, 1999
188.247 mln
+5.034 mln
2.75%
jan 1, 2000
193.634 mln
+5.387 mln
2.86%
jan 1, 2001
199.251 mln
+5.617 mln
2.9%
jan 1, 2002
204.667 mln
+5.416 mln
2.72%
jan 1, 2003
210.573 mln
+5.906 mln
2.89%
jan 1, 2004
216.545 mln
+5.972 mln
2.84%
jan 1, 2005
222.797 mln
+6.252 mln
2.89%
jan 1, 2006
229.7 mln
+6.904 mln
3.1%
jan 1, 2007
236.779 mln
+7.079 mln
3.08%
jan 1, 2008
244.091 mln
+7.311 mln
3.09%
jan 1, 2009
251.898 mln
+7.807 mln
3.2%
jan 1, 2010
260.032 mln
+8.135 mln
3.23%
jan 1, 2011
268.532 mln
+8.5 mln
3.27%
jan 1, 2012
276.898 mln
+8.365 mln
3.12%
jan 1, 2013
285.637 mln
+8.739 mln
3.16%
jan 1, 2014
294.839 mln
+9.202 mln
3.22%
jan 1, 2015
304.421 mln
+9.582 mln
3.25%
Ranking of countries by current statistics by years


Comments: