29
/
en
AIzaSyAYiBZKx7MnpbEhh9jyipgxe19OcubqV5w
April 1, 2024
106180
China
CHN
true
2
1
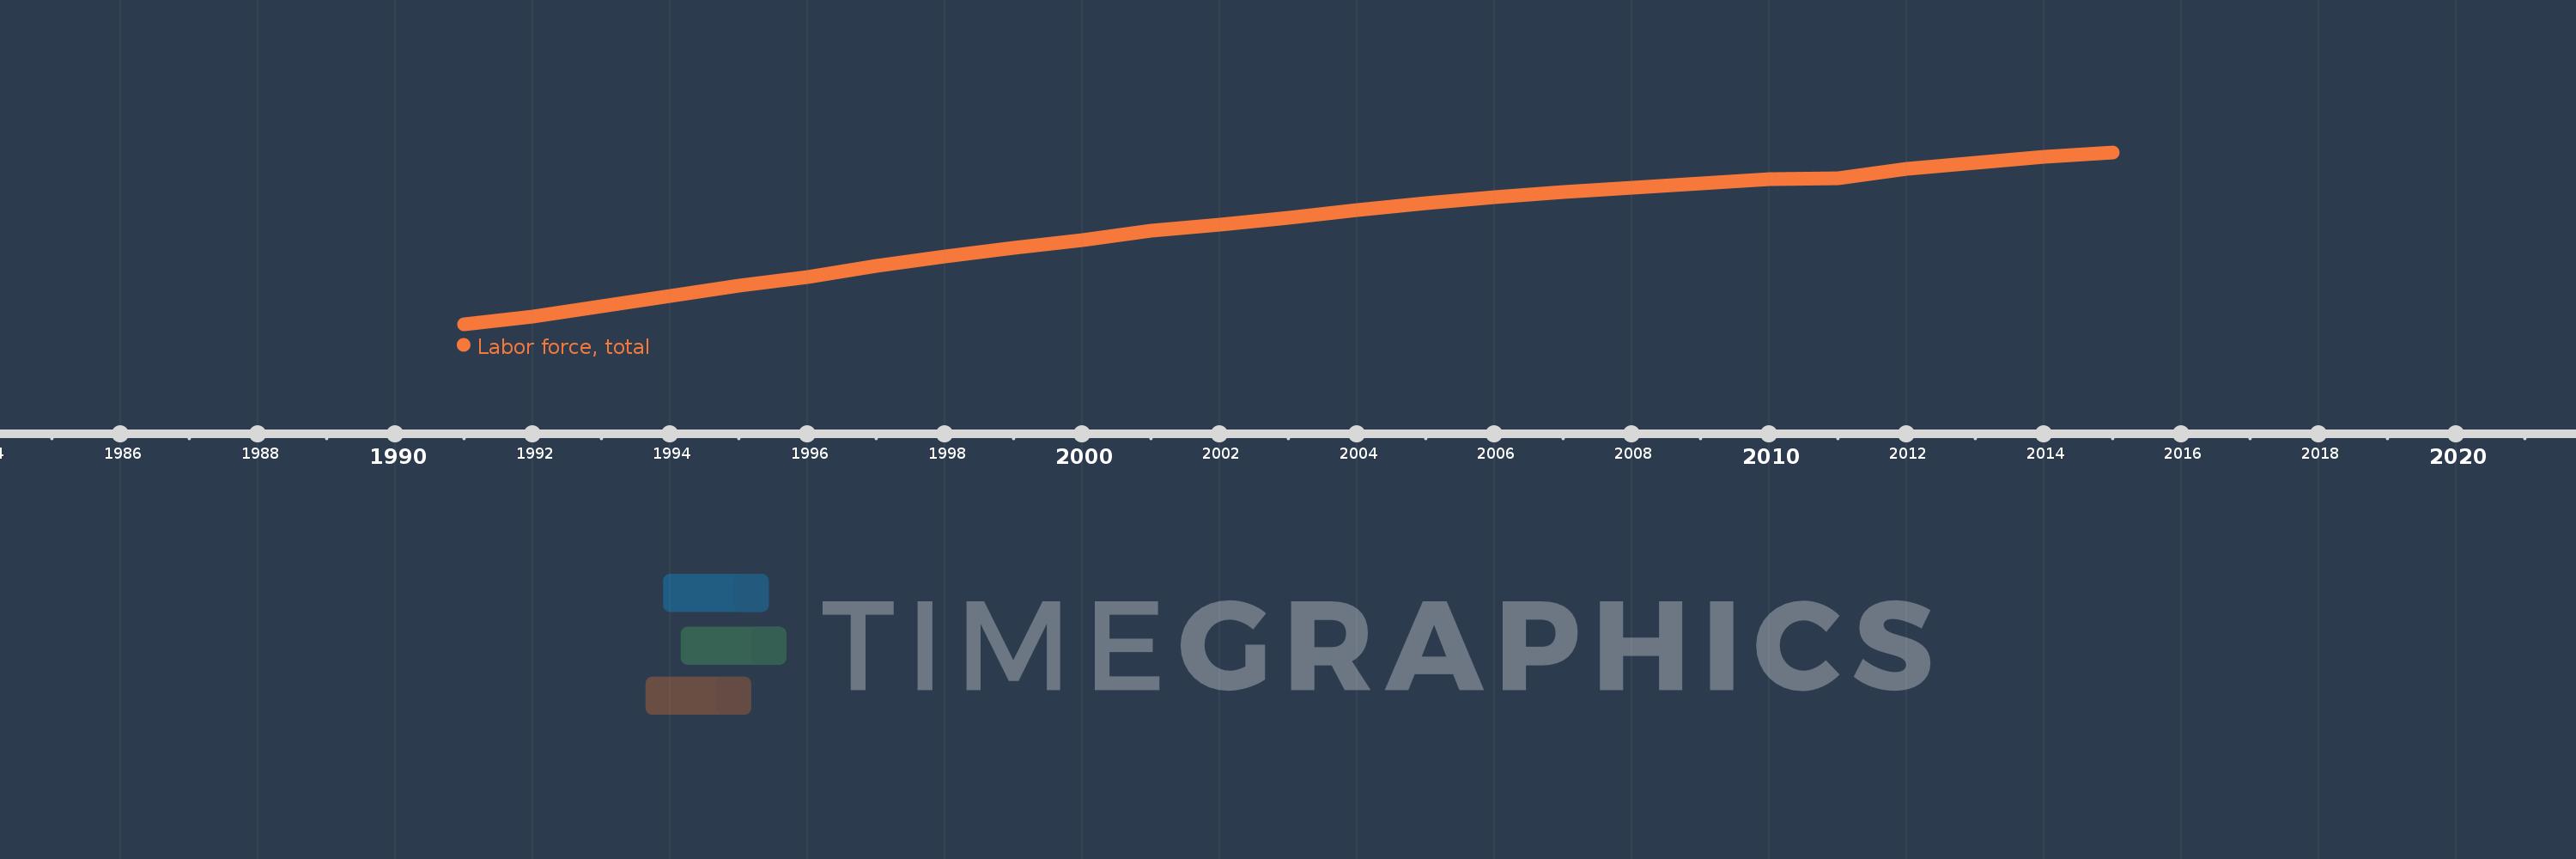
Labor force, total
2015,2014,2013,2012,2011,2010,2009,2008,2007,2006,2005,2004,2003,2002,2001,2000,1999,1998,1997,1996,1995,1994,1993,1992,1991
This statistics in other country:
AfghanistanAlbaniaAlgeriaAngolaArab WorldArgentinaArmeniaAustraliaAustriaAzerbaijanBahamas, TheBahrainBangladeshBarbadosBelarusBelgiumBelizeBeninBhutanBoliviaBosnia and HerzegovinaBotswanaBrazilBrunei DarussalamBulgariaBurkina FasoBurundiCabo VerdeCambodiaCameroonCanadaCaribbean small statesCentral African RepublicCentral Europe and the BalticsChadChannel IslandsChileChinaColombiaComorosCongo, Dem. Rep.Congo, Rep.Costa RicaCote d'IvoireCroatiaCubaCyprusCzech RepublicDenmarkDjiboutiDominican RepublicEarly-demographic dividendEast Asia & PacificEast Asia & Pacific (excluding high income)East Asia & Pacific (IDA & IBRD countries)EcuadorEgypt, Arab Rep.El SalvadorEquatorial GuineaEritreaEstoniaEthiopiaEuro areaEurope & Central AsiaEurope & Central Asia (excluding high income)Europe & Central Asia (IDA & IBRD countries)European UnionFijiFinlandFragile and conflict affected situationsFranceFrench PolynesiaGabonGambia, TheGeorgiaGermanyGhanaGreeceGuamGuatemalaGuineaGuinea-BissauGuyanaHaitiHeavily indebted poor countries (HIPC)High incomeHondurasHong Kong SAR, ChinaHungaryIBRD onlyIcelandIDA & IBRD totalIDA blendIDA onlyIDA totalIndiaIndonesiaIran, Islamic Rep.IraqIrelandIsraelItalyJamaicaJapanJordanKazakhstanKenyaKorea, Dem. People’s Rep.Korea, Rep.KuwaitKyrgyz RepublicLao PDRLate-demographic dividendLatin America & Caribbean Latin America & Caribbean (excluding high income)Latin America & the Caribbean (IDA & IBRD countries)LatviaLeast developed countries: UN classificationLebanonLesothoLiberiaLibyaLithuaniaLow & middle incomeLow incomeLower middle incomeLuxembourgMacao SAR, ChinaMacedonia, FYRMadagascarMalawiMalaysiaMaldivesMaliMaltaMauritaniaMauritiusMexicoMiddle East & North AfricaMiddle East & North Africa (excluding high income)Middle East & North Africa (IDA & IBRD countries)Middle incomeMoldovaMongoliaMontenegroMoroccoMozambiqueMyanmarNamibiaNepalNetherlandsNew CaledoniaNew ZealandNicaraguaNigerNigeriaNorth AmericaNorwayOECD membersOmanOther small statesPacific island small statesPakistanPanamaPapua New GuineaParaguayPeruPhilippinesPolandPortugalPost-demographic dividendPre-demographic dividendPuerto RicoQatarRomaniaRussian FederationRwandaSamoaSao Tome and PrincipeSaudi ArabiaSenegalSerbiaSierra LeoneSingaporeSlovak RepublicSloveniaSmall statesSolomon IslandsSomaliaSouth AfricaSouth AsiaSouth Asia (IDA & IBRD)SpainSri LankaSt. LuciaSt. Vincent and the GrenadinesSub-Saharan Africa Sub-Saharan Africa (excluding high income)Sub-Saharan Africa (IDA & IBRD countries)SudanSurinameSwazilandSwedenSwitzerlandSyrian Arab RepublicTajikistanTanzaniaThailandTimor-LesteTogoTongaTrinidad and TobagoTunisiaTurkeyTurkmenistanUgandaUkraineUnited Arab EmiratesUnited KingdomUnited StatesUpper middle incomeUruguayUzbekistanVanuatuVenezuela, RBVietnamVirgin Islands (U.S.)West Bank and GazaWorldYemen, Rep.ZambiaZimbabwe Timeline:
This timeline shows a graph from 1991 to 2015 of China. No data until 1990. Number of actual observations by date: 25.
Source name:
World Development Indicators
Source organization:
International Labour Organization, using World Bank population estimates.
Categories, topics:
Education, Social Protection & Labor
Last updated:
apr 23, 2017
Indicators value changes by year
Minimum:
637.334 mln
jan 1, 1991
Maximum:
806.499 mln
jan 1, 2015
At the date of observation
Value
Absolute change
Change from previous value
jan 1, 1991
637.334 mln
+637.334 mln
0.0%
jan 1, 1992
645.036 mln
+7.701 mln
1.21%
jan 1, 1993
654.896 mln
+9.86 mln
1.53%
jan 1, 1994
665.457 mln
+10.561 mln
1.61%
jan 1, 1995
674.952 mln
+9.495 mln
1.43%
jan 1, 1996
683.686 mln
+8.734 mln
1.29%
jan 1, 1997
695.031 mln
+11.345 mln
1.66%
jan 1, 1998
704.442 mln
+9.411 mln
1.35%
jan 1, 1999
712.176 mln
+7.734 mln
1.1%
jan 1, 2000
719.957 mln
+7.781 mln
1.09%
jan 1, 2001
729.49 mln
+9.533 mln
1.32%
jan 1, 2002
735.54 mln
+6.05 mln
0.83%
jan 1, 2003
742.456 mln
+6.915 mln
0.94%
jan 1, 2004
749.74 mln
+7.285 mln
0.98%
jan 1, 2005
756.305 mln
+6.565 mln
0.88%
jan 1, 2006
762.608 mln
+6.303 mln
0.83%
jan 1, 2007
767.137 mln
+4.529 mln
0.59%
jan 1, 2008
772.098 mln
+4.961 mln
0.65%
jan 1, 2009
776.126 mln
+4.027 mln
0.52%
jan 1, 2010
779.868 mln
+3.742 mln
0.48%
jan 1, 2011
781.055 mln
+1.187 mln
0.15%
jan 1, 2012
790.183 mln
+9.128 mln
1.17%
jan 1, 2013
795.863 mln
+5.68 mln
0.72%
jan 1, 2014
801.791 mln
+5.927 mln
0.74%
jan 1, 2015
806.499 mln
+4.708 mln
0.59%
Ranking of countries by current statistics by years


Comments: