29
/
en
AIzaSyAYiBZKx7MnpbEhh9jyipgxe19OcubqV5w
April 1, 2024
55050
Post-demographic dividend
PST
false
2
1
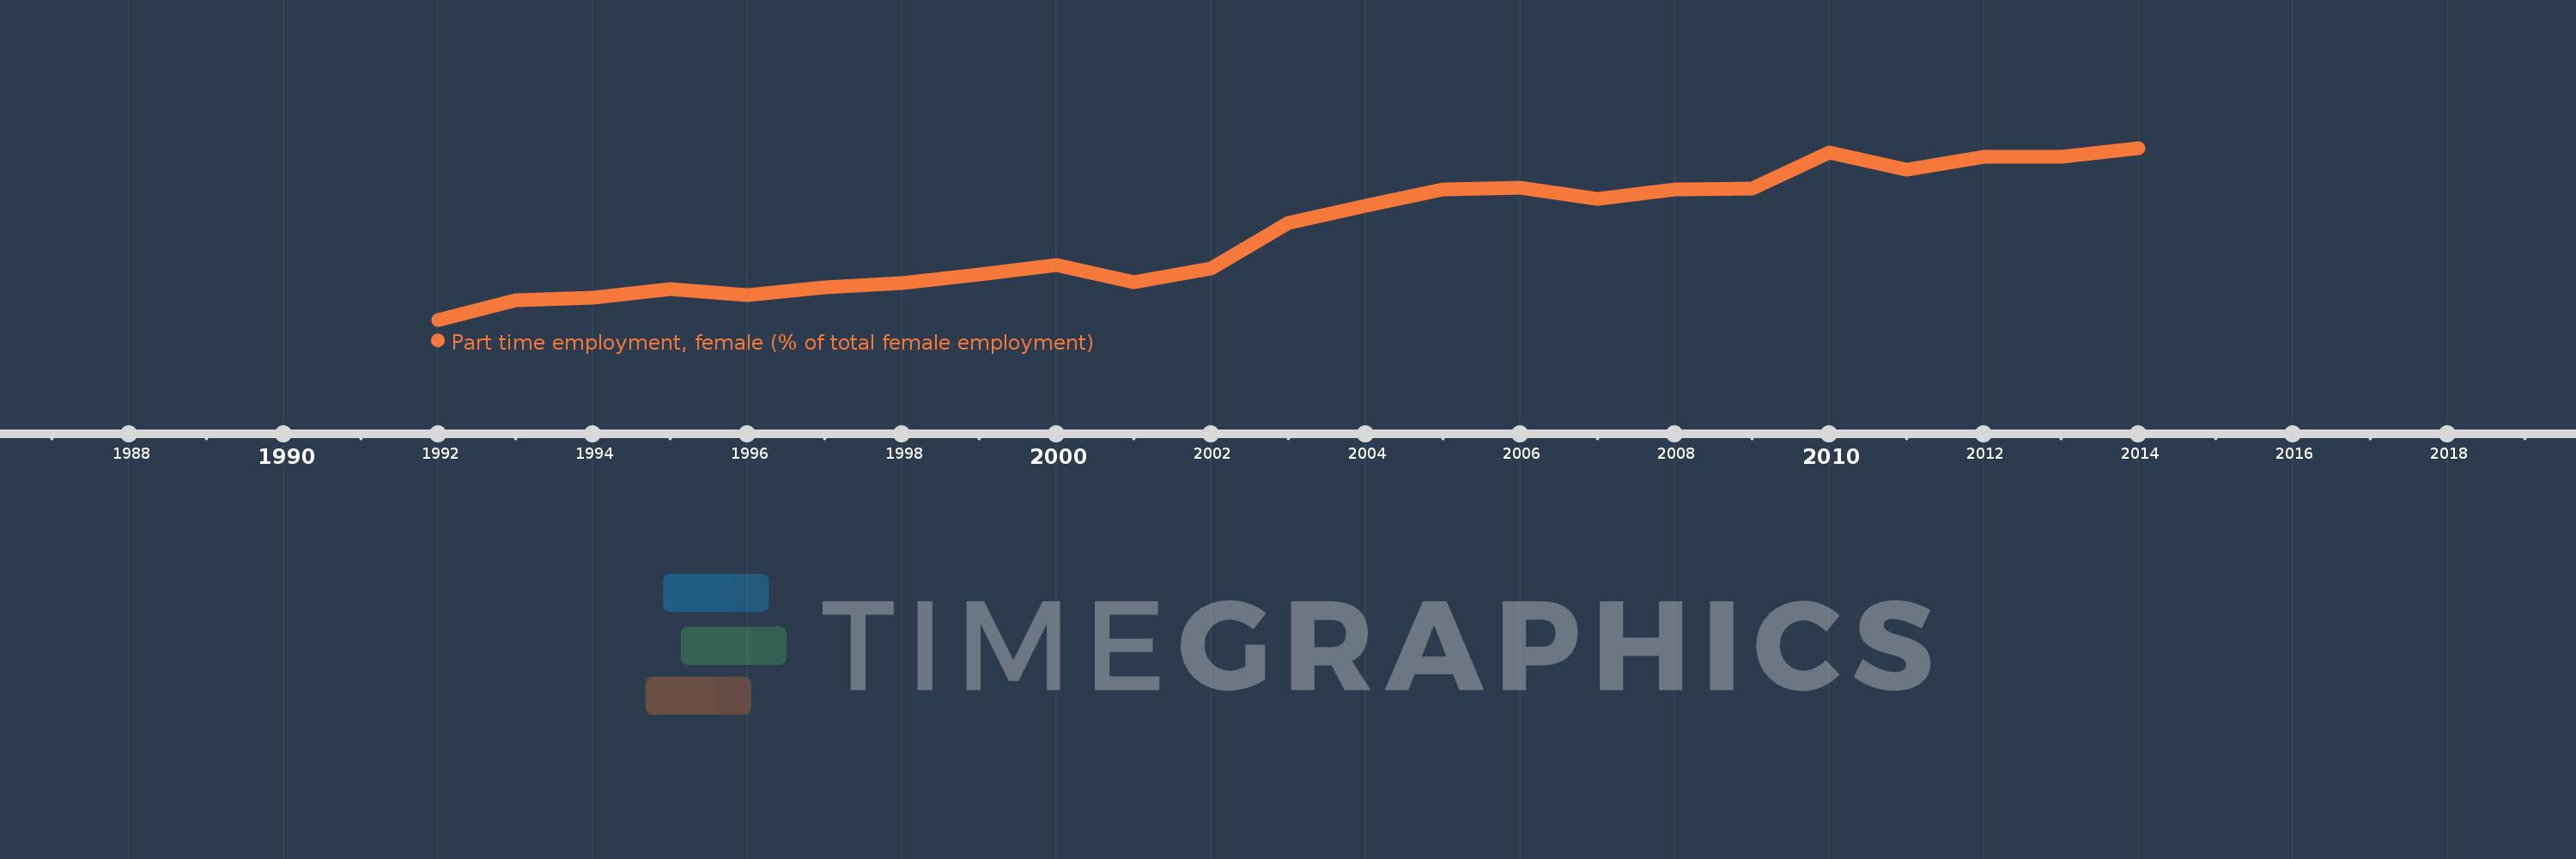
Part time employment, female (% of total female employment)
2014,2013,2012,2011,2010,2009,2008,2007,2006,2005,2004,2003,2002,2001,2000,1999,1998,1997,1996,1995,1994,1993,1992
This statistics in other country:
Timeline:
This timeline shows a graph from 1992 to 2014 of Post-demographic dividend. No data until 1991. Number of actual observations by date: 23.
Source name:
World Development Indicators
Source organization:
International Labour Organization, Key Indicators of the Labour Market database.
Categories, topics:
Social Protection & Labor, Gender
Last updated:
apr 23, 2017
Indicators value changes by year
Minimum:
22.207
jan 1, 1992
Maximum:
26.082
jan 1, 2014
At the date of observation
Value
Absolute change
Change from previous value
jan 1, 1992
22.207
+22.207
0.0%
jan 1, 1993
22.645
+0.438
1.97%
jan 1, 1994
22.706
+0.061
0.27%
jan 1, 1995
22.893
+0.187
0.82%
jan 1, 1996
22.765
-0.128
-0.56%
jan 1, 1997
22.944
+0.179
0.79%
jan 1, 1998
23.042
+0.098
0.43%
jan 1, 1999
23.235
+0.193
0.84%
jan 1, 2000
23.446
+0.211
0.91%
jan 1, 2001
23.053
-0.393
-1.68%
jan 1, 2002
23.362
+0.308
1.34%
jan 1, 2003
24.395
+1.033
4.42%
jan 1, 2004
24.78
+0.385
1.58%
jan 1, 2005
25.148
+0.369
1.49%
jan 1, 2006
25.192
+0.044
0.17%
jan 1, 2007
24.941
-0.251
-1.0%
jan 1, 2008
25.137
+0.196
0.79%
jan 1, 2009
25.172
+0.035
0.14%
jan 1, 2010
25.975
+0.803
3.19%
jan 1, 2011
25.599
-0.376
-1.45%
jan 1, 2012
25.887
+0.287
1.12%
jan 1, 2013
25.89
+0.003
0.01%
jan 1, 2014
26.082
+0.193
0.74%
Ranking of countries by current statistics by years


Comments: