29
/
en
AIzaSyAYiBZKx7MnpbEhh9jyipgxe19OcubqV5w
April 1, 2024
52138
North America
NAC
false
2
1
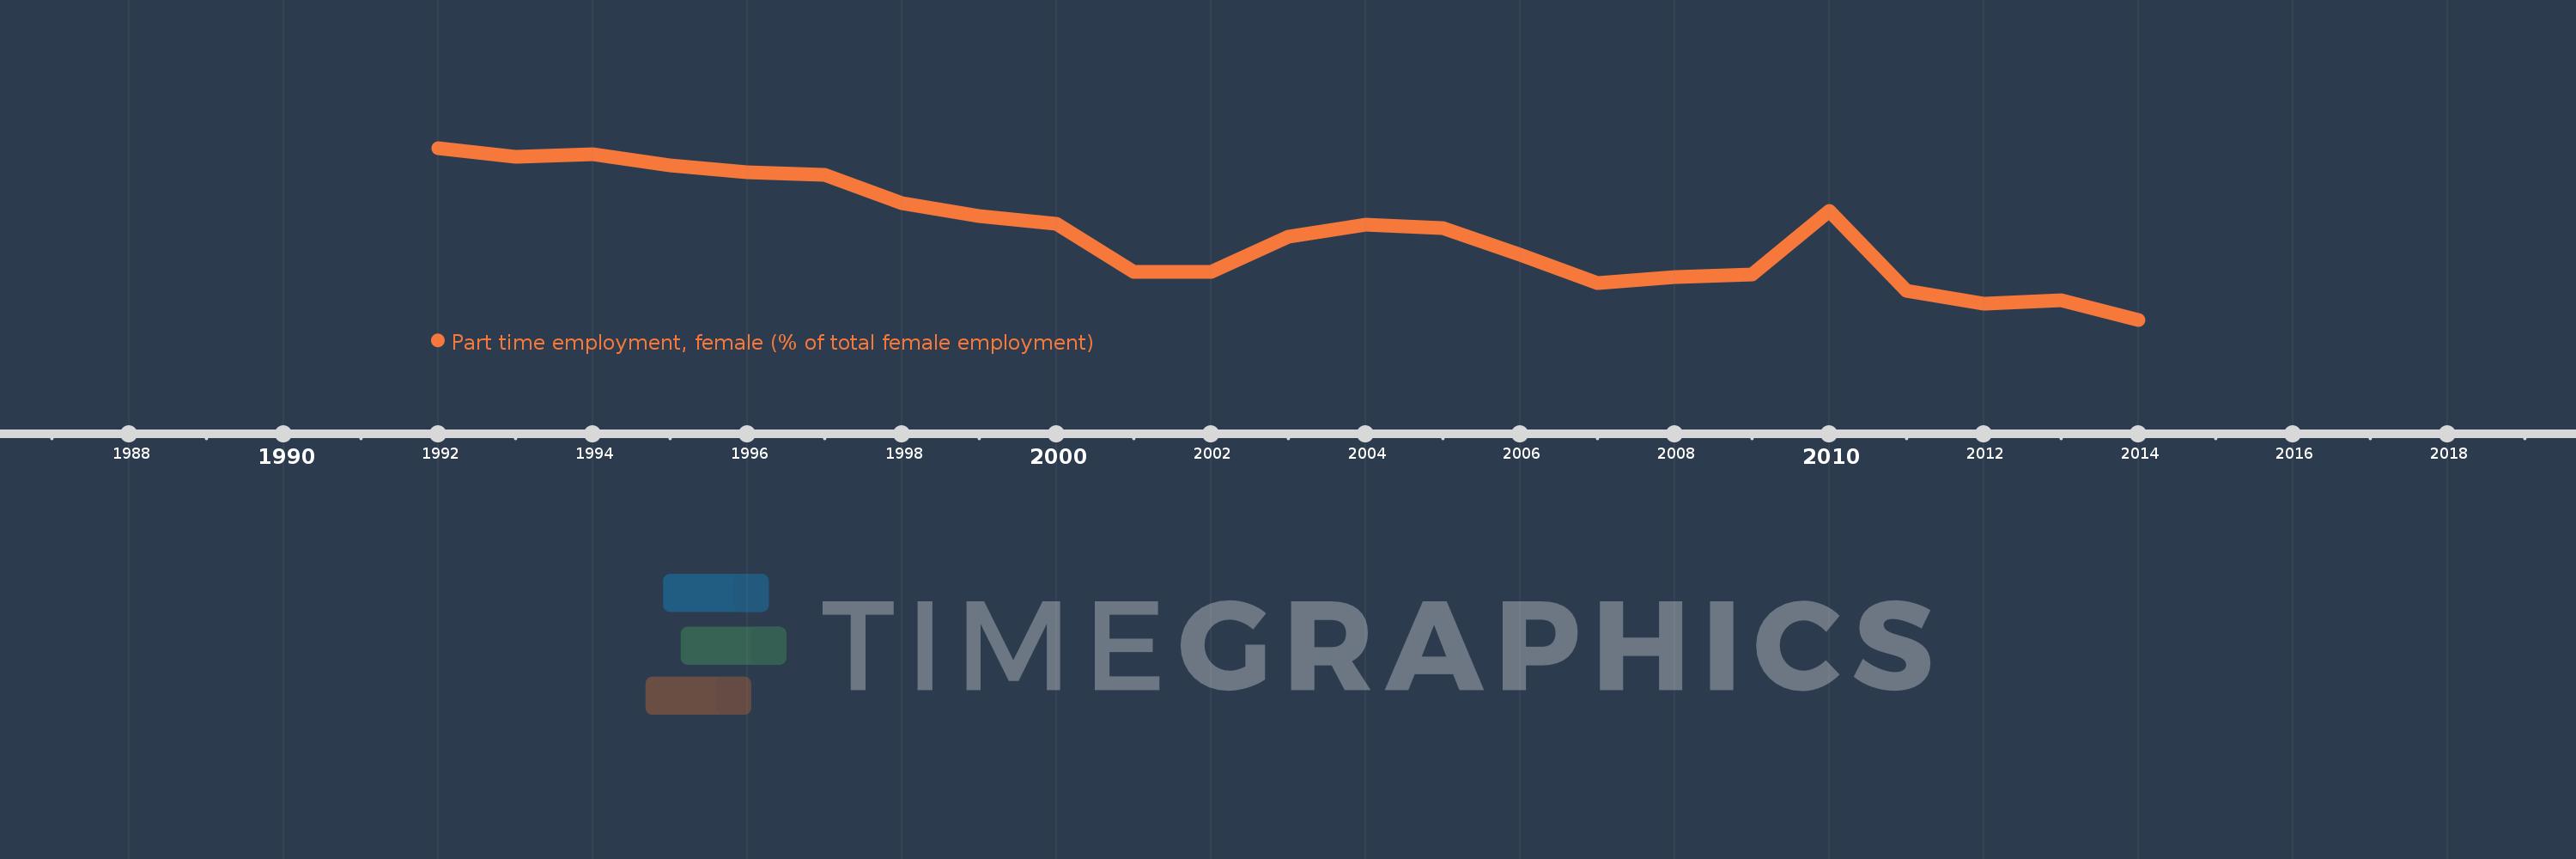
Part time employment, female (% of total female employment)
2014,2013,2012,2011,2010,2009,2008,2007,2006,2005,2004,2003,2002,2001,2000,1999,1998,1997,1996,1995,1994,1993,1992
This statistics in other country:
Timeline:
This timeline shows a graph from 1992 to 2014 of North America. No data until 1991. Number of actual observations by date: 23.
Source name:
World Development Indicators
Source organization:
International Labour Organization, Key Indicators of the Labour Market database.
Categories, topics:
Social Protection & Labor, Gender
Last updated:
apr 23, 2017
Indicators value changes by year
Minimum:
16.669
jan 1, 2014
Maximum:
19.798
jan 1, 1992
At the date of observation
Value
Absolute change
Change from previous value
jan 1, 1992
19.798
+19.798
0.0%
jan 1, 1993
19.634
-0.164
-0.83%
jan 1, 1994
19.689
+0.055
0.28%
jan 1, 1995
19.484
-0.206
-1.04%
jan 1, 1996
19.361
-0.123
-0.63%
jan 1, 1997
19.31
-0.05
-0.26%
jan 1, 1998
18.793
-0.517
-2.68%
jan 1, 1999
18.558
-0.235
-1.25%
jan 1, 2000
18.409
-0.149
-0.8%
jan 1, 2001
17.539
-0.87
-4.73%
jan 1, 2002
17.533
-0.006
-0.03%
jan 1, 2003
18.176
+0.643
3.66%
jan 1, 2004
18.397
+0.221
1.21%
jan 1, 2005
18.333
-0.064
-0.35%
jan 1, 2006
17.851
-0.482
-2.63%
jan 1, 2007
17.343
-0.508
-2.85%
jan 1, 2008
17.448
+0.106
0.61%
jan 1, 2009
17.493
+0.044
0.25%
jan 1, 2010
18.646
+1.154
6.59%
jan 1, 2011
17.194
-1.452
-7.79%
jan 1, 2012
16.962
-0.232
-1.35%
jan 1, 2013
17.02
+0.057
0.34%
jan 1, 2014
16.669
-0.351
-2.06%
Ranking of countries by current statistics by years


Comments: