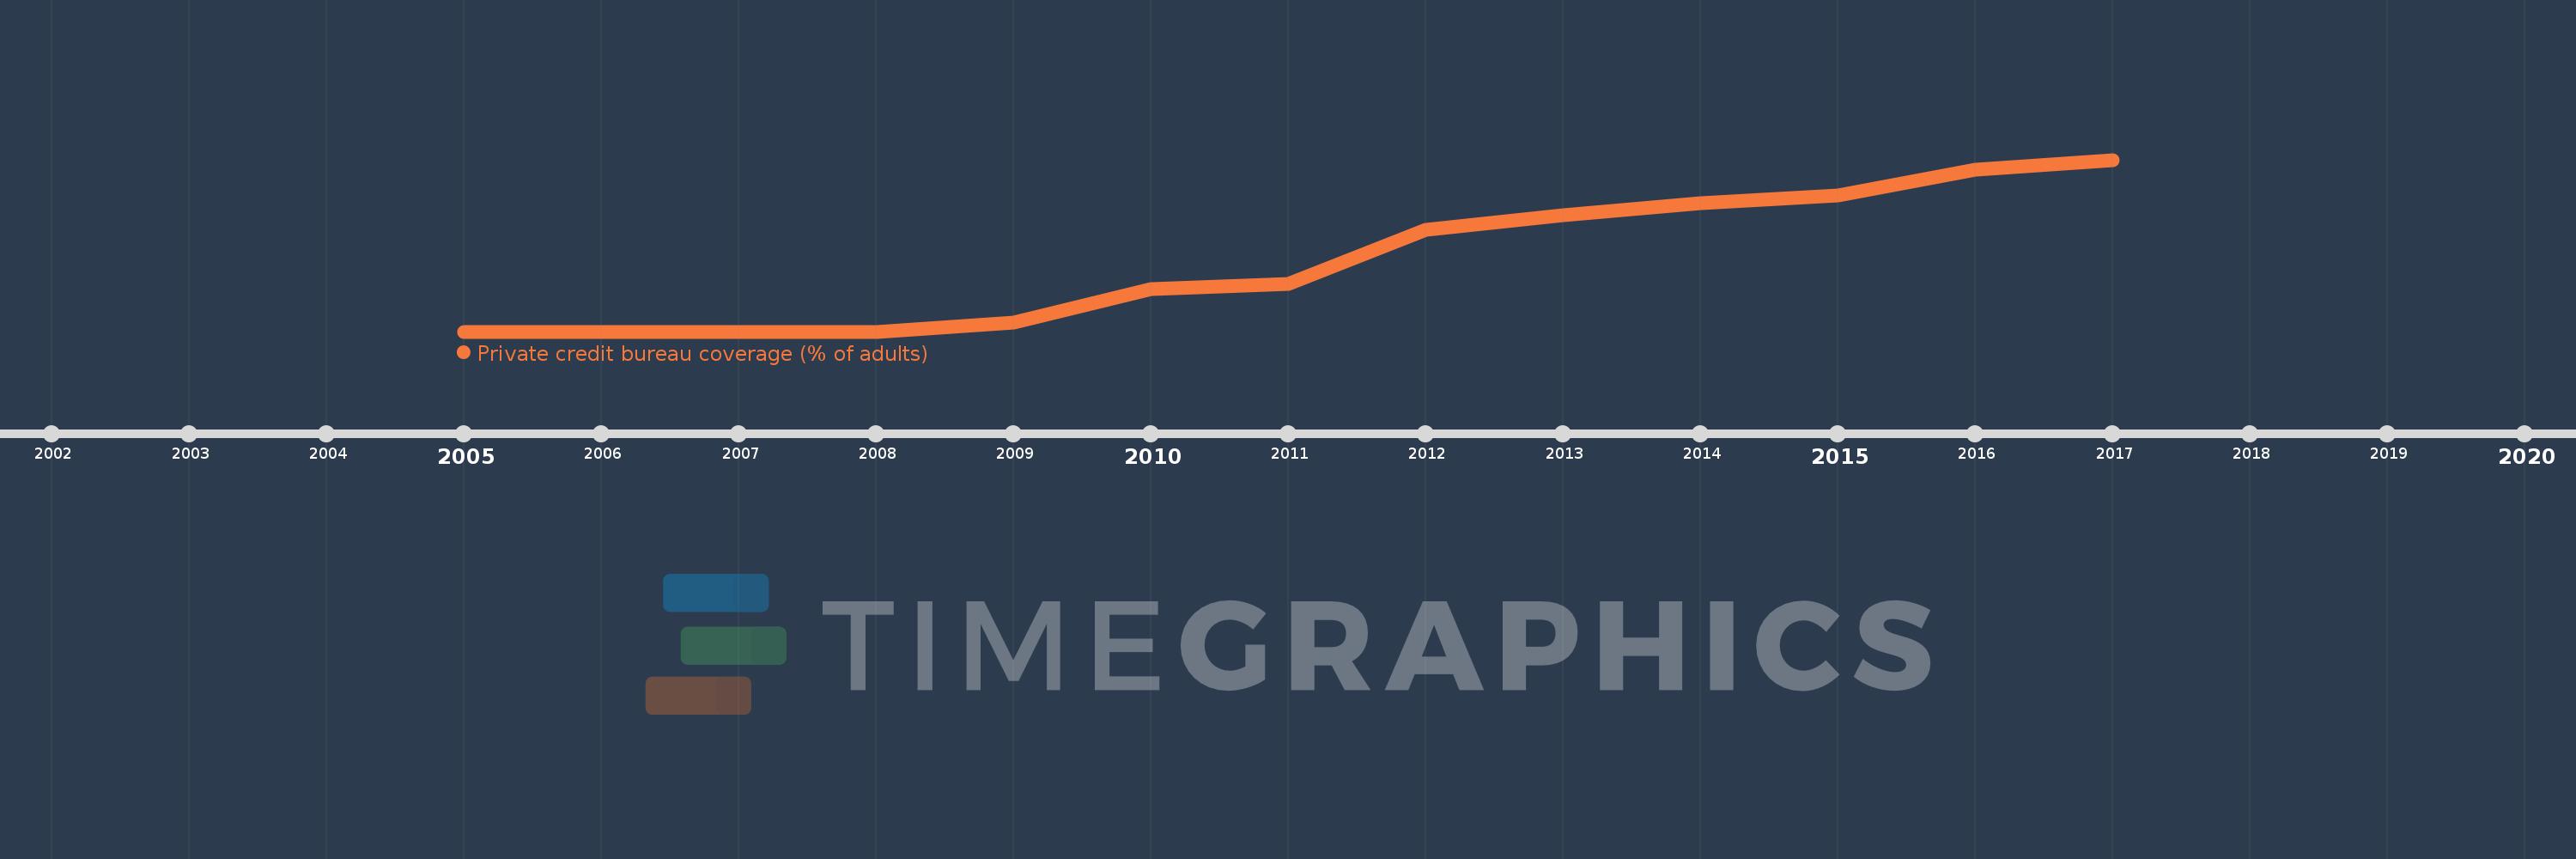
This timeline shows a graph from 2005 to 2017 of Middle East & North Africa (excluding high income). No data until 2004. Number of actual observations by date: 13.
Source name:
World Development Indicators
Source organization:
World Bank, Doing Business project (http://www.doingbusiness.org/).
Categories, topics:
Financial Sector, Private Sector
Last updated:
apr 23, 2017
Indicators value changes by year
Meaning:
3.049
Minimum:
0.0
jan 1, 2005
Maximum:
7.438
jan 1, 2017
At the date of observation
Value
Absolute change
Change from the previous value
jan 1, 2005
0.0
0.0
0.0%
jan 1, 2006
0.0
0.0
%
jan 1, 2007
0.0
0.0
%
jan 1, 2008
0.0
0.0
%
jan 1, 2009
0.392
+0.392
%
jan 1, 2010
1.85
+1.458
372.34%
jan 1, 2011
2.058
+0.208
11.26%
jan 1, 2012
4.392
+2.333
113.36%
jan 1, 2013
5.038
+0.647
14.73%
jan 1, 2014
5.577
+0.538
10.69%
jan 1, 2015
5.9
+0.323
5.79%
jan 1, 2016
6.992
+1.092
18.51%
jan 1, 2017
7.438
+0.446
6.38%
Ranking of countries by current statistics by years
