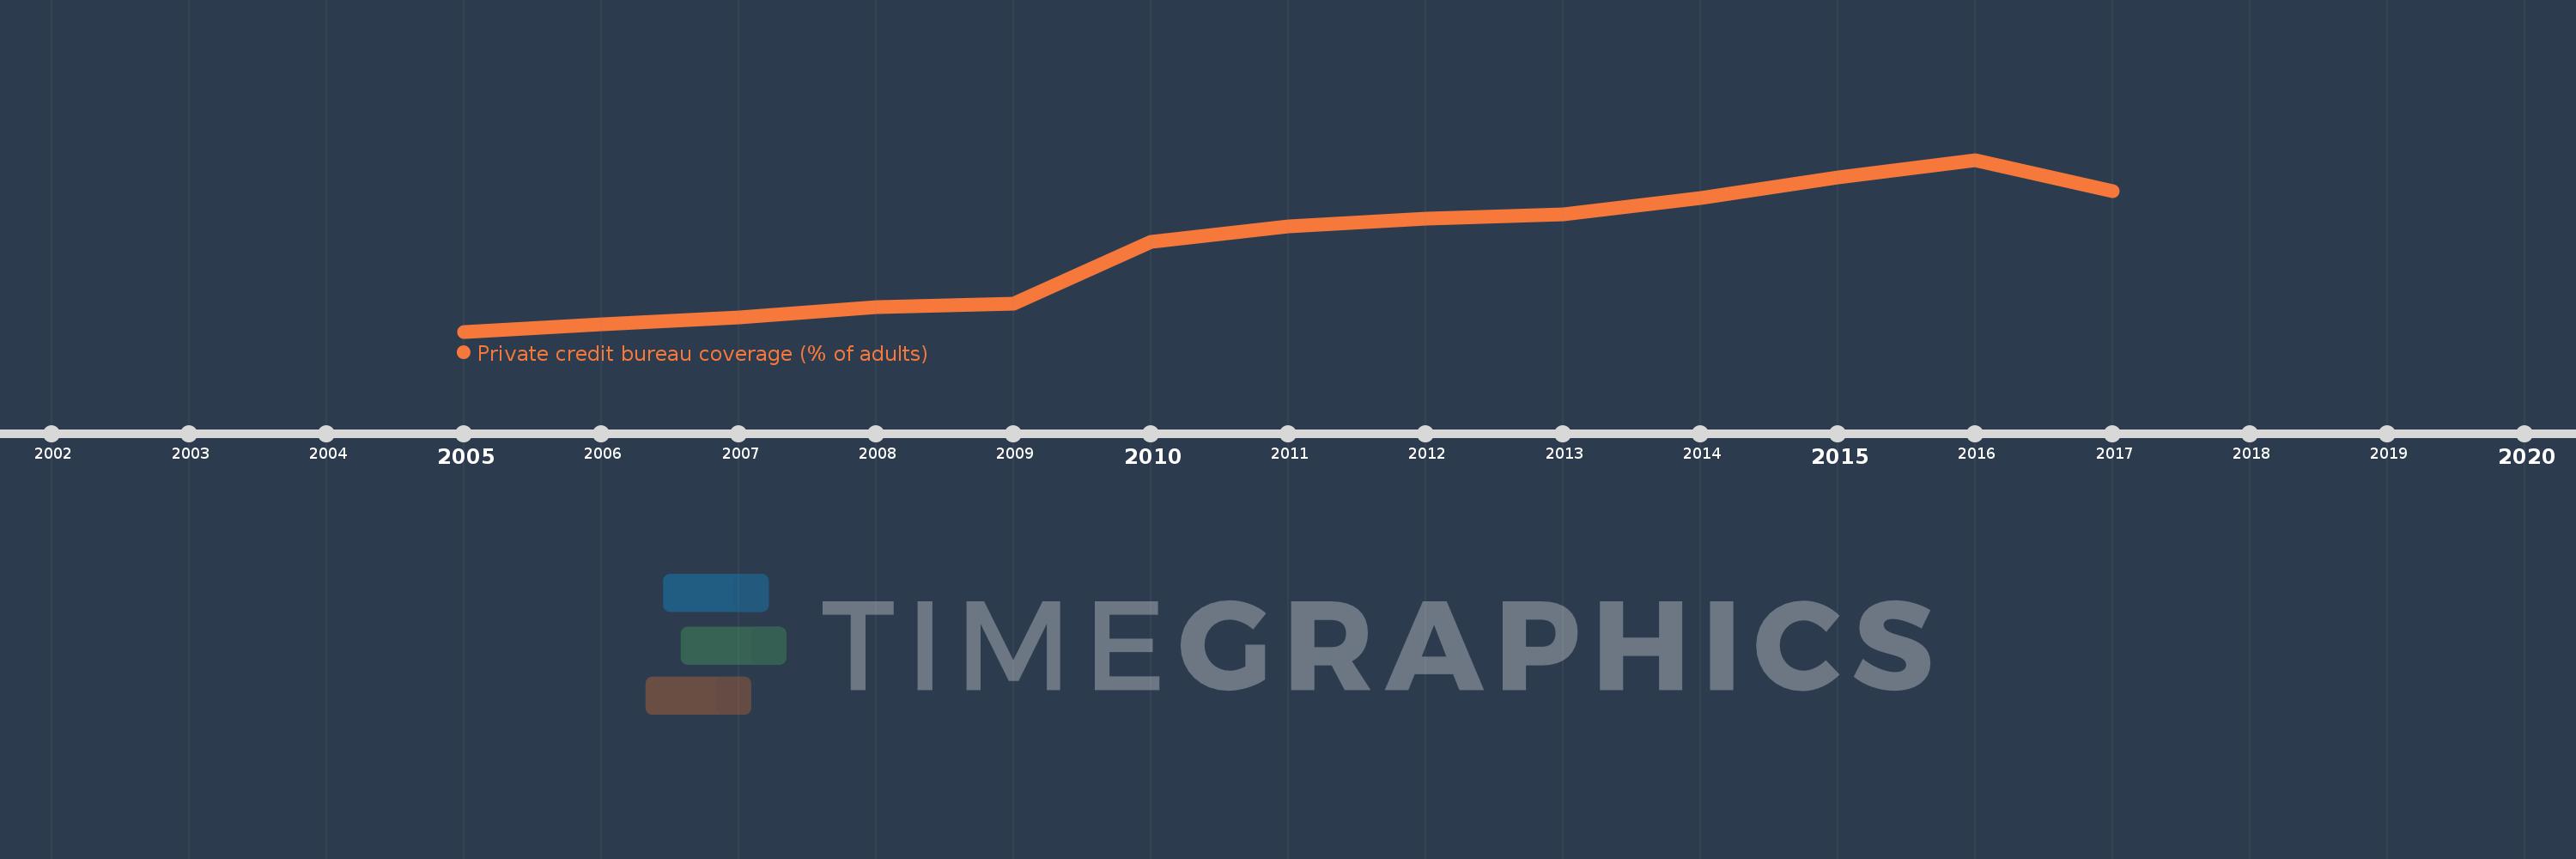
This timeline shows a graph from 2005 to 2017 of East Asia & Pacific (excluding high income). No data until 2004. Number of actual observations by date: 13.
Source name:
World Development Indicators
Source organization:
World Bank, Doing Business project (http://www.doingbusiness.org/).
Categories, topics:
Financial Sector, Private Sector
Last updated:
apr 23, 2017
Indicators value changes by year
Meaning:
8.081
Minimum:
1.98
jan 1, 2005
Maximum:
14.376
jan 1, 2016
At the date of observation
Value
Absolute change
Change from the previous value
jan 1, 2005
1.98
+1.98
0.0%
jan 1, 2006
2.525
+0.545
27.53%
jan 1, 2007
3.005
+0.48
19.01%
jan 1, 2008
3.74
+0.735
24.46%
jan 1, 2009
3.975
+0.235
6.28%
jan 1, 2010
8.48
+4.505
113.33%
jan 1, 2011
9.57
+1.09
12.85%
jan 1, 2012
10.135
+0.565
5.9%
jan 1, 2013
10.448
+0.313
3.08%
jan 1, 2014
11.643
+1.195
11.44%
jan 1, 2015
13.09
+1.448
12.43%
jan 1, 2016
14.376
+1.286
9.82%
jan 1, 2017
12.086
-2.29
-15.93%
Ranking of countries by current statistics by years
