29
/
en
AIzaSyAYiBZKx7MnpbEhh9jyipgxe19OcubqV5w
April 1, 2024
48749
Middle East & North Africa (excluding high income)
MNA
false
2
1
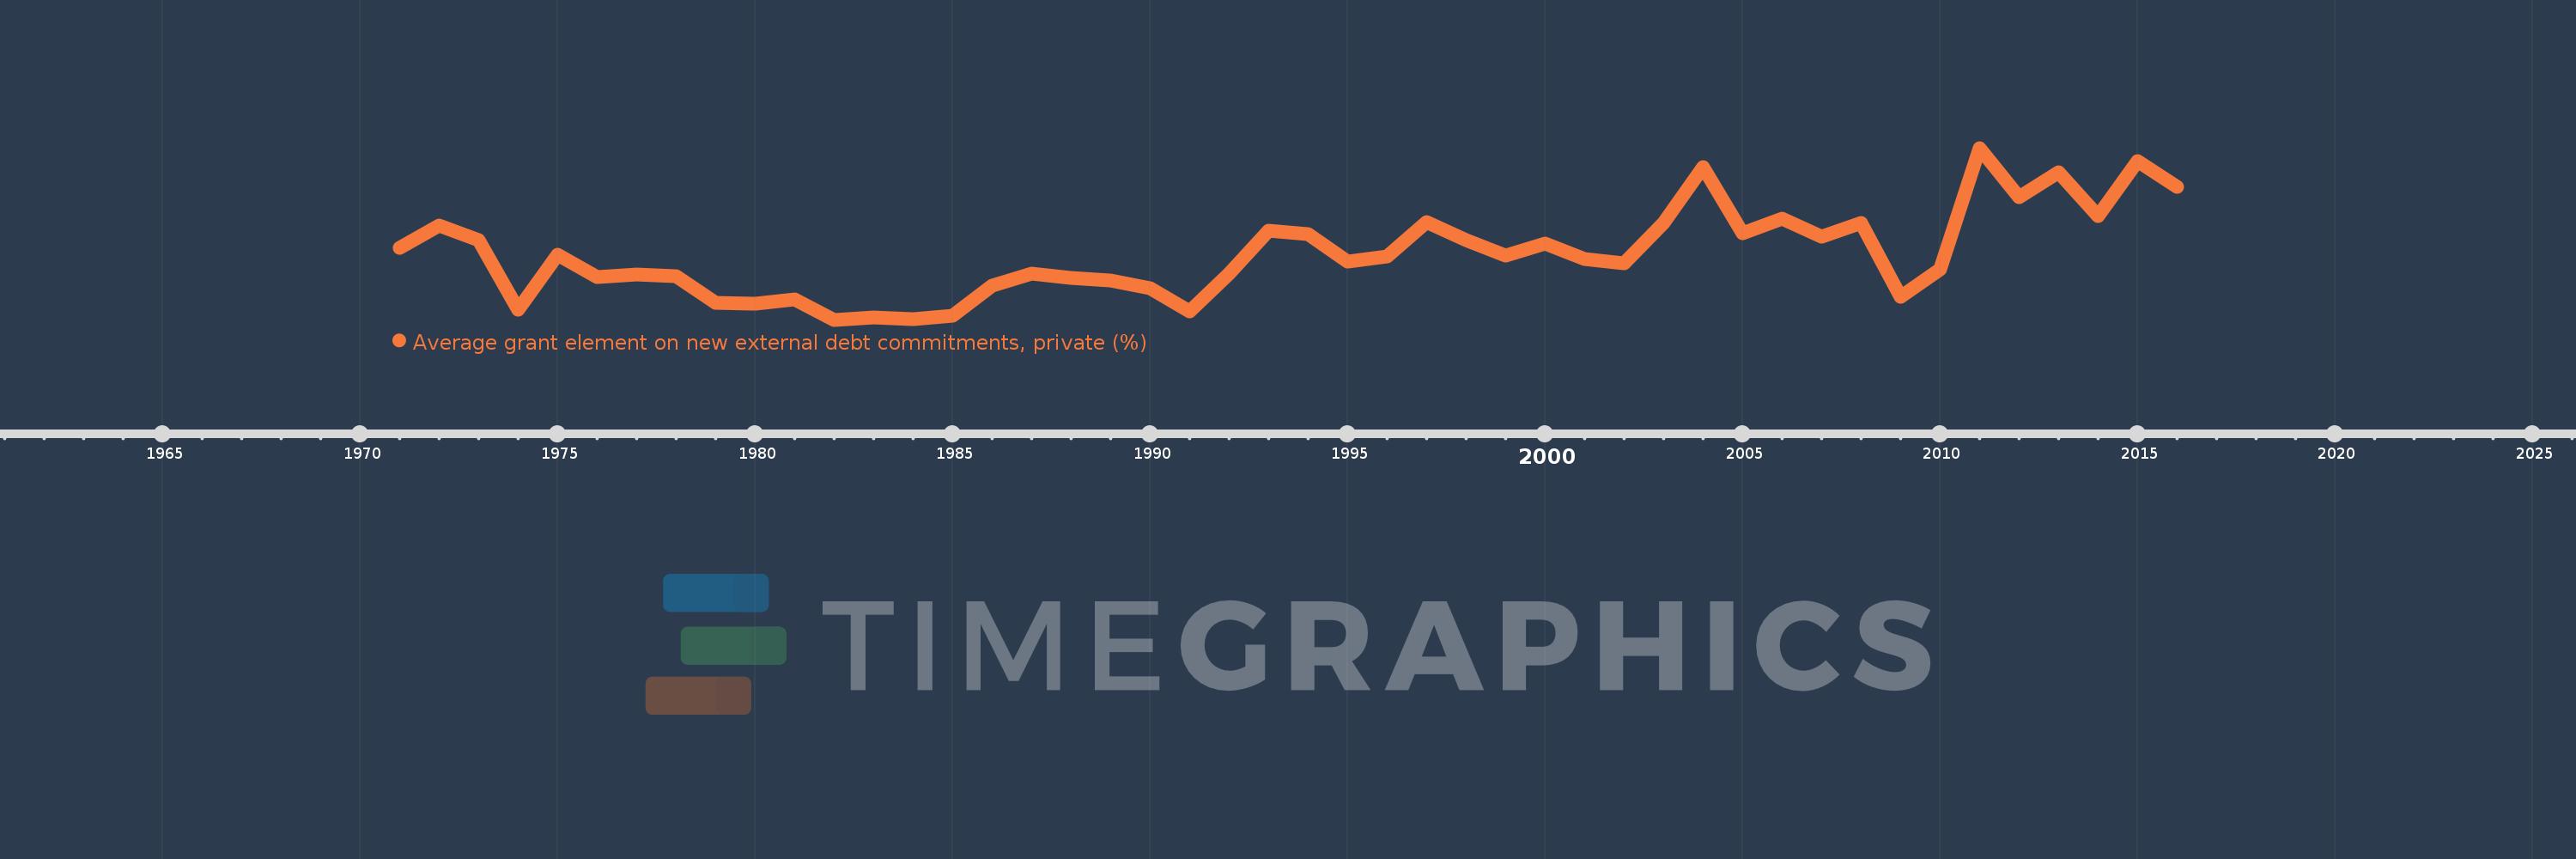
Average grant element on new external debt commitments, private (%)
2016,2015,2014,2013,2012,2011,2010,2009,2008,2007,2006,2005,2004,2003,2002,2001,2000,1999,1998,1997,1996,1995,1994,1993,1992,1991,1990,1989,1988,1987,1986,1985,1984,1983,1982,1981,1980,1979,1978,1977,1976,1975,1974,1973,1972,1971
This statistics in other country:
Timeline:
This timeline shows a graph from 1971 to 2016 of Middle East & North Africa (excluding high income). No data until 1970. Number of actual observations by date: 46.
Source name:
World Development Indicators
Source organization:
World Bank, International Debt Statistics.
Categories, topics:
External Debt
Last updated:
apr 23, 2017
Indicators value changes by year
Maximum:
32.913
jan 1, 2011
At the date of observation
Value
Absolute change
Change from previous value
jan 1, 1971
14.675
+14.675
0.0%
jan 1, 1972
18.667
+3.992
27.2%
jan 1, 1973
16.119
-2.548
-13.65%
jan 1, 1974
3.305
-12.813
-79.49%
jan 1, 1975
13.436
+10.13
306.48%
jan 1, 1976
9.243
-4.193
-31.21%
jan 1, 1977
9.732
+0.489
5.29%
jan 1, 1978
9.423
-0.309
-3.17%
jan 1, 1979
4.514
-4.909
-52.09%
jan 1, 1980
4.431
-0.084
-1.85%
jan 1, 1981
5.187
+0.756
17.06%
jan 1, 1982
1.494
-3.692
-71.19%
jan 1, 1983
1.905
+0.411
27.51%
jan 1, 1984
1.604
-0.302
-15.84%
jan 1, 1985
2.186
+0.582
36.29%
jan 1, 1986
7.708
+5.522
252.67%
jan 1, 1987
9.89
+2.182
28.31%
jan 1, 1988
9.07
-0.821
-8.3%
jan 1, 1989
8.691
-0.379
-4.18%
jan 1, 1990
7.268
-1.423
-16.38%
jan 1, 1991
3.089
-4.179
-57.5%
jan 1, 1992
9.944
+6.855
221.95%
jan 1, 1993
17.742
+7.798
78.42%
jan 1, 1994
17.201
-0.541
-3.05%
jan 1, 1995
12.121
-5.08
-29.53%
jan 1, 1996
13.089
+0.968
7.98%
jan 1, 1997
19.379
+6.29
48.06%
jan 1, 1998
16.042
-3.337
-17.22%
jan 1, 1999
13.252
-2.79
-17.39%
jan 1, 2000
15.466
+2.214
16.71%
jan 1, 2001
12.667
-2.799
-18.1%
jan 1, 2002
11.82
-0.847
-6.69%
jan 1, 2003
19.23
+7.411
62.7%
jan 1, 2004
29.438
+10.207
53.08%
jan 1, 2005
17.356
-12.082
-41.04%
jan 1, 2006
20.028
+2.672
15.39%
jan 1, 2007
16.691
-3.337
-16.66%
jan 1, 2008
19.205
+2.514
15.07%
jan 1, 2009
5.669
-13.536
-70.48%
jan 1, 2010
10.786
+5.117
90.25%
jan 1, 2011
32.913
+22.127
205.15%
jan 1, 2012
23.902
-9.011
-27.38%
jan 1, 2013
28.524
+4.621
19.33%
jan 1, 2014
20.385
-8.138
-28.53%
jan 1, 2015
30.51
+10.124
49.66%
jan 1, 2016
25.825
-4.685
-15.36%
Ranking of countries by current statistics by years


Comments: