29
/
en
AIzaSyAYiBZKx7MnpbEhh9jyipgxe19OcubqV5w
April 1, 2024
245245
South Africa
ZAF
true
2
1
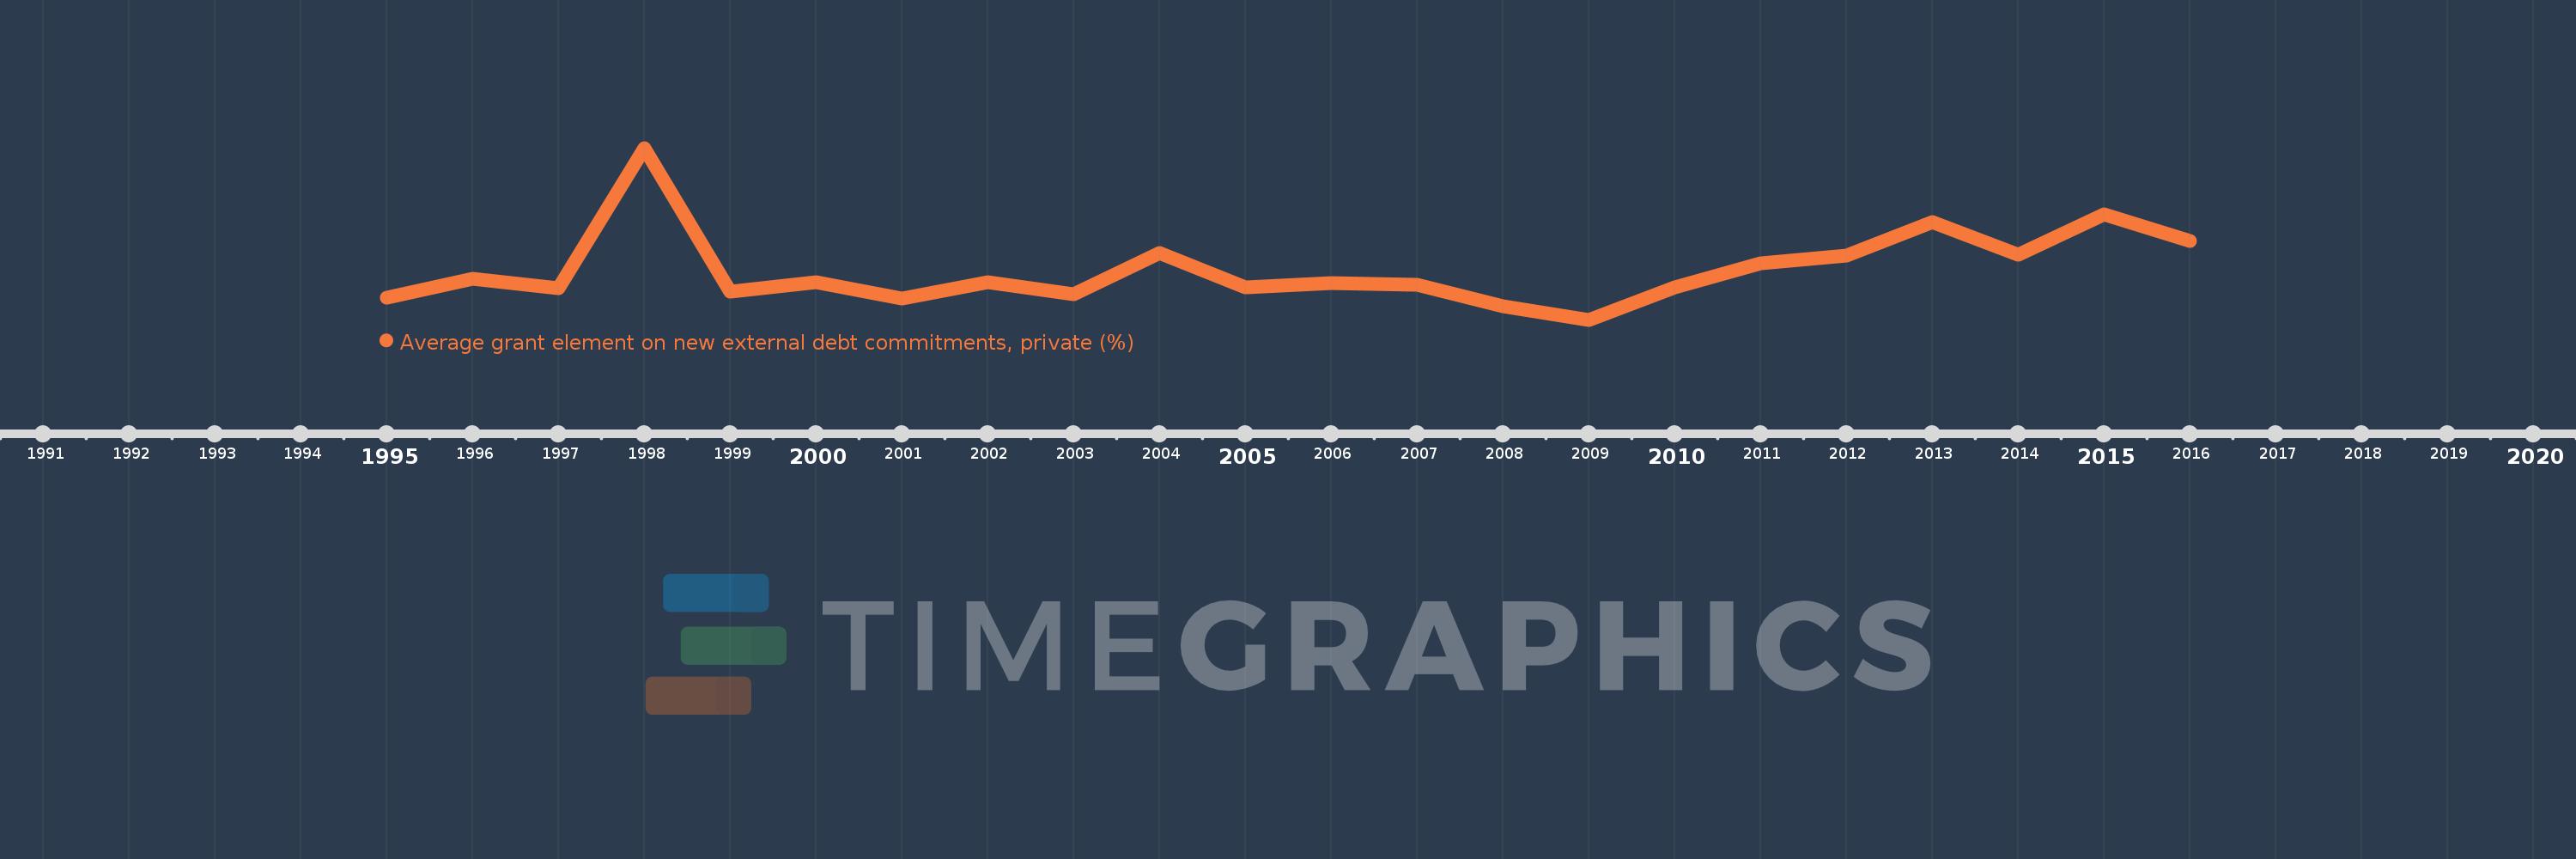
Average grant element on new external debt commitments, private (%)
2016,2015,2014,2013,2012,2011,2010,2009,2008,2007,2006,2005,2004,2003,2002,2001,2000,1999,1998,1997,1996,1995
This statistics in other country:
Timeline:
This timeline shows a graph from 1995 to 2016 of South Africa. No data until 1994. Number of actual observations by date: 22.
Source name:
World Development Indicators
Source organization:
World Bank, International Debt Statistics.
Categories, topics:
External Debt
Last updated:
apr 23, 2017
Indicators value changes by year
Minimum:
10.391
jan 1, 2009
Maximum:
56.593
jan 1, 1998
At the date of observation
Value
Absolute change
Change from previous value
jan 1, 1995
16.285
+16.285
0.0%
jan 1, 1996
21.325
+5.039
30.94%
jan 1, 1997
18.869
-2.456
-11.52%
jan 1, 1998
56.593
+37.724
199.92%
jan 1, 1999
18.015
-38.577
-68.17%
jan 1, 2000
20.496
+2.481
13.77%
jan 1, 2001
16.031
-4.466
-21.79%
jan 1, 2002
20.384
+4.353
27.15%
jan 1, 2003
17.179
-3.205
-15.72%
jan 1, 2004
28.399
+11.221
65.32%
jan 1, 2005
18.998
-9.401
-33.1%
jan 1, 2006
20.261
+1.262
6.64%
jan 1, 2007
19.797
-0.464
-2.29%
jan 1, 2008
14.021
-5.776
-29.18%
jan 1, 2009
10.391
-3.63
-25.89%
jan 1, 2010
19.048
+8.658
83.32%
jan 1, 2011
25.601
+6.553
34.4%
jan 1, 2012
27.651
+2.05
8.01%
jan 1, 2013
36.557
+8.907
32.21%
jan 1, 2014
27.952
-8.605
-23.54%
jan 1, 2015
38.837
+10.884
38.94%
jan 1, 2016
31.483
-7.353
-18.93%
Ranking of countries by current statistics by years


Comments: