29
/
en
AIzaSyAYiBZKx7MnpbEhh9jyipgxe19OcubqV5w
April 1, 2024
45959
Low income
LIC
false
2
1
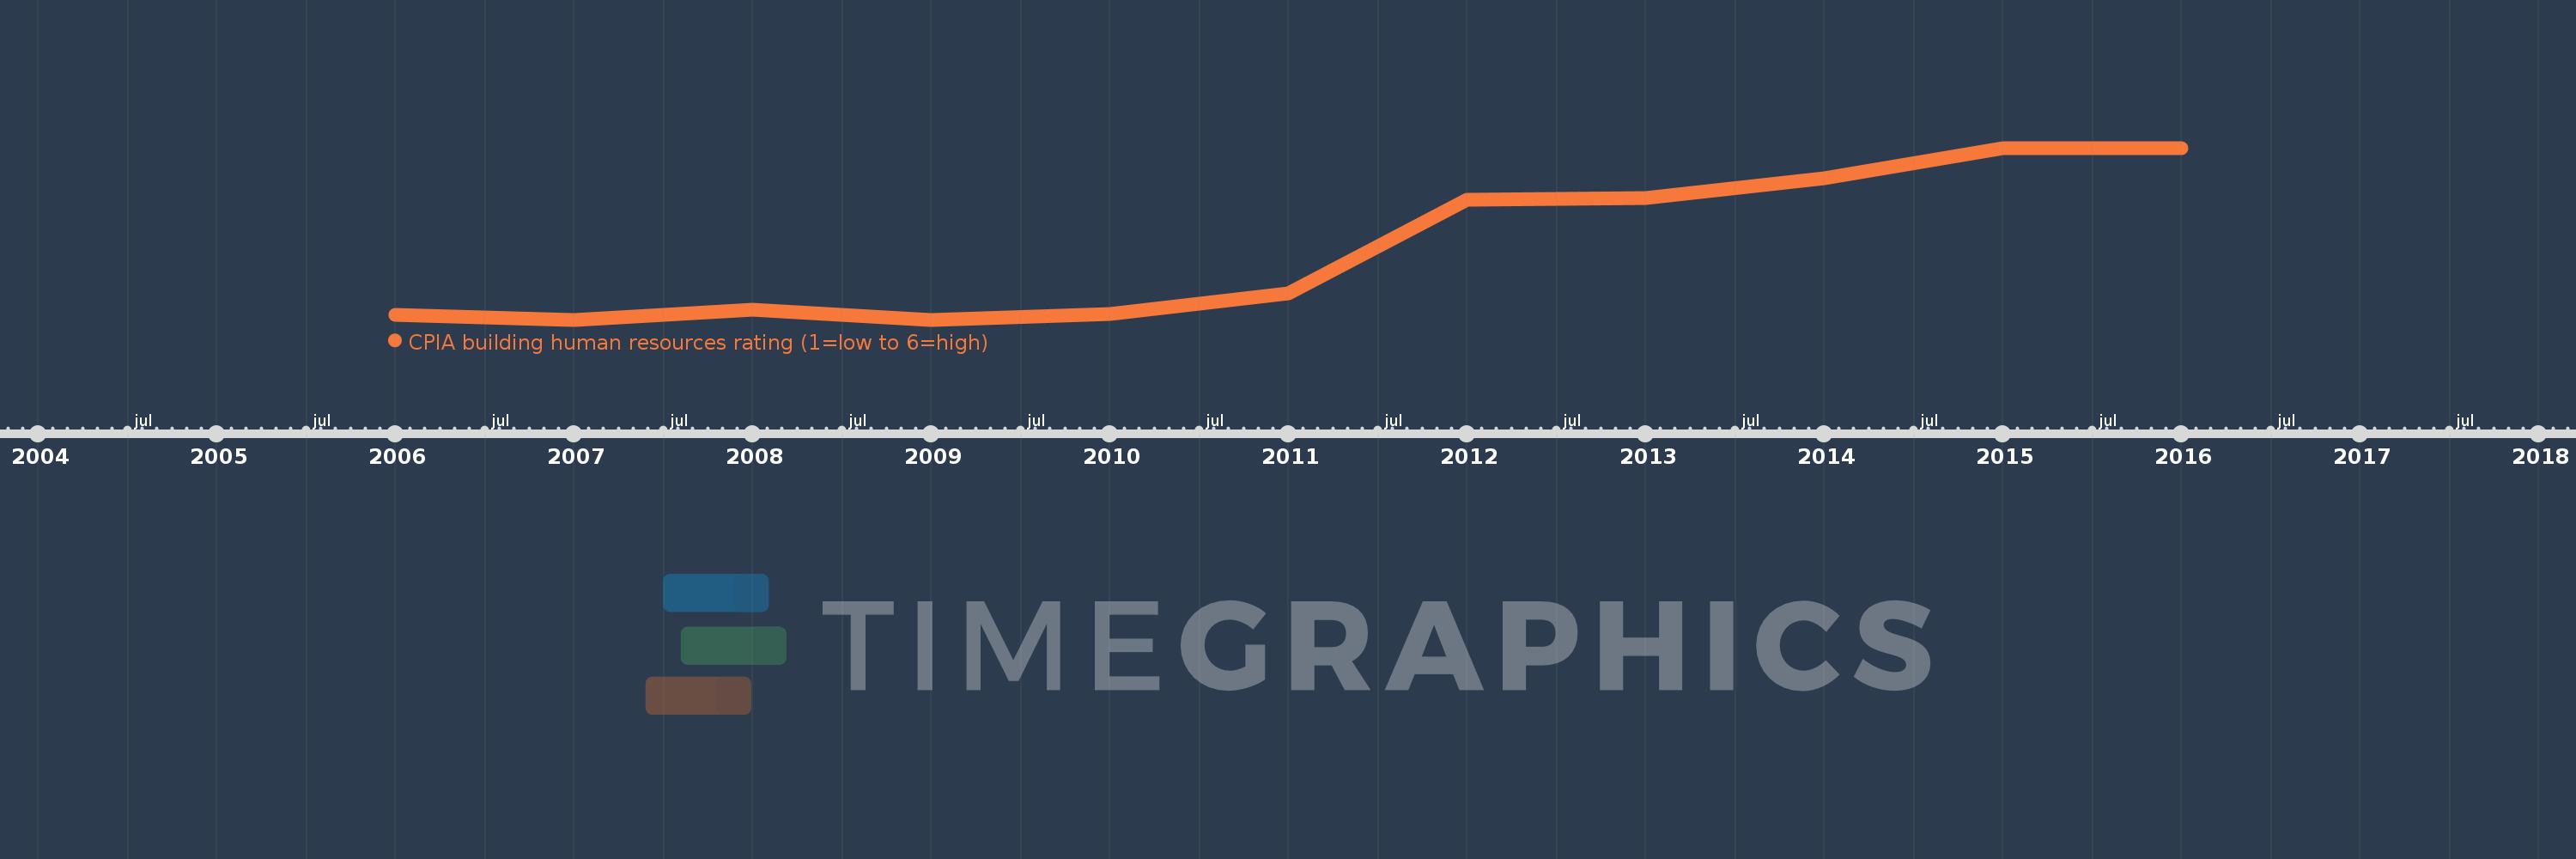
CPIA building human resources rating (1=low to 6=high)
2016,2015,2014,2013,2012,2011,2010,2009,2008,2007,2006
This statistics in other country:
Timeline:
This timeline shows a graph from 2006 to 2016 of Low income. No data until 2005. Number of actual observations by date: 11.
Source name:
World Development Indicators
Source organization:
World Bank Group, CPIA database (http://www.worldbank.org/ida).
Categories, topics:
Public Sector
Last updated:
apr 23, 2017
Indicators value changes by year
At the date of observation
Value
Absolute change
Change from previous value
jan 1, 2006
3.212
+3.212
0.0%
jan 1, 2007
3.204
-0.008
-0.24%
jan 1, 2008
3.222
+0.019
0.58%
jan 1, 2009
3.204
-0.019
-0.57%
jan 1, 2010
3.214
+0.011
0.33%
jan 1, 2011
3.25
+0.036
1.11%
jan 1, 2012
3.411
+0.161
4.95%
jan 1, 2013
3.414
+0.003
0.09%
jan 1, 2014
3.448
+0.034
1.01%
jan 1, 2015
3.5
+0.052
1.5%
Ranking of countries by current statistics by years


Comments: