29
/
en
AIzaSyAYiBZKx7MnpbEhh9jyipgxe19OcubqV5w
April 1, 2024
34120
Fragile and conflict affected situations
FCS
false
2
1
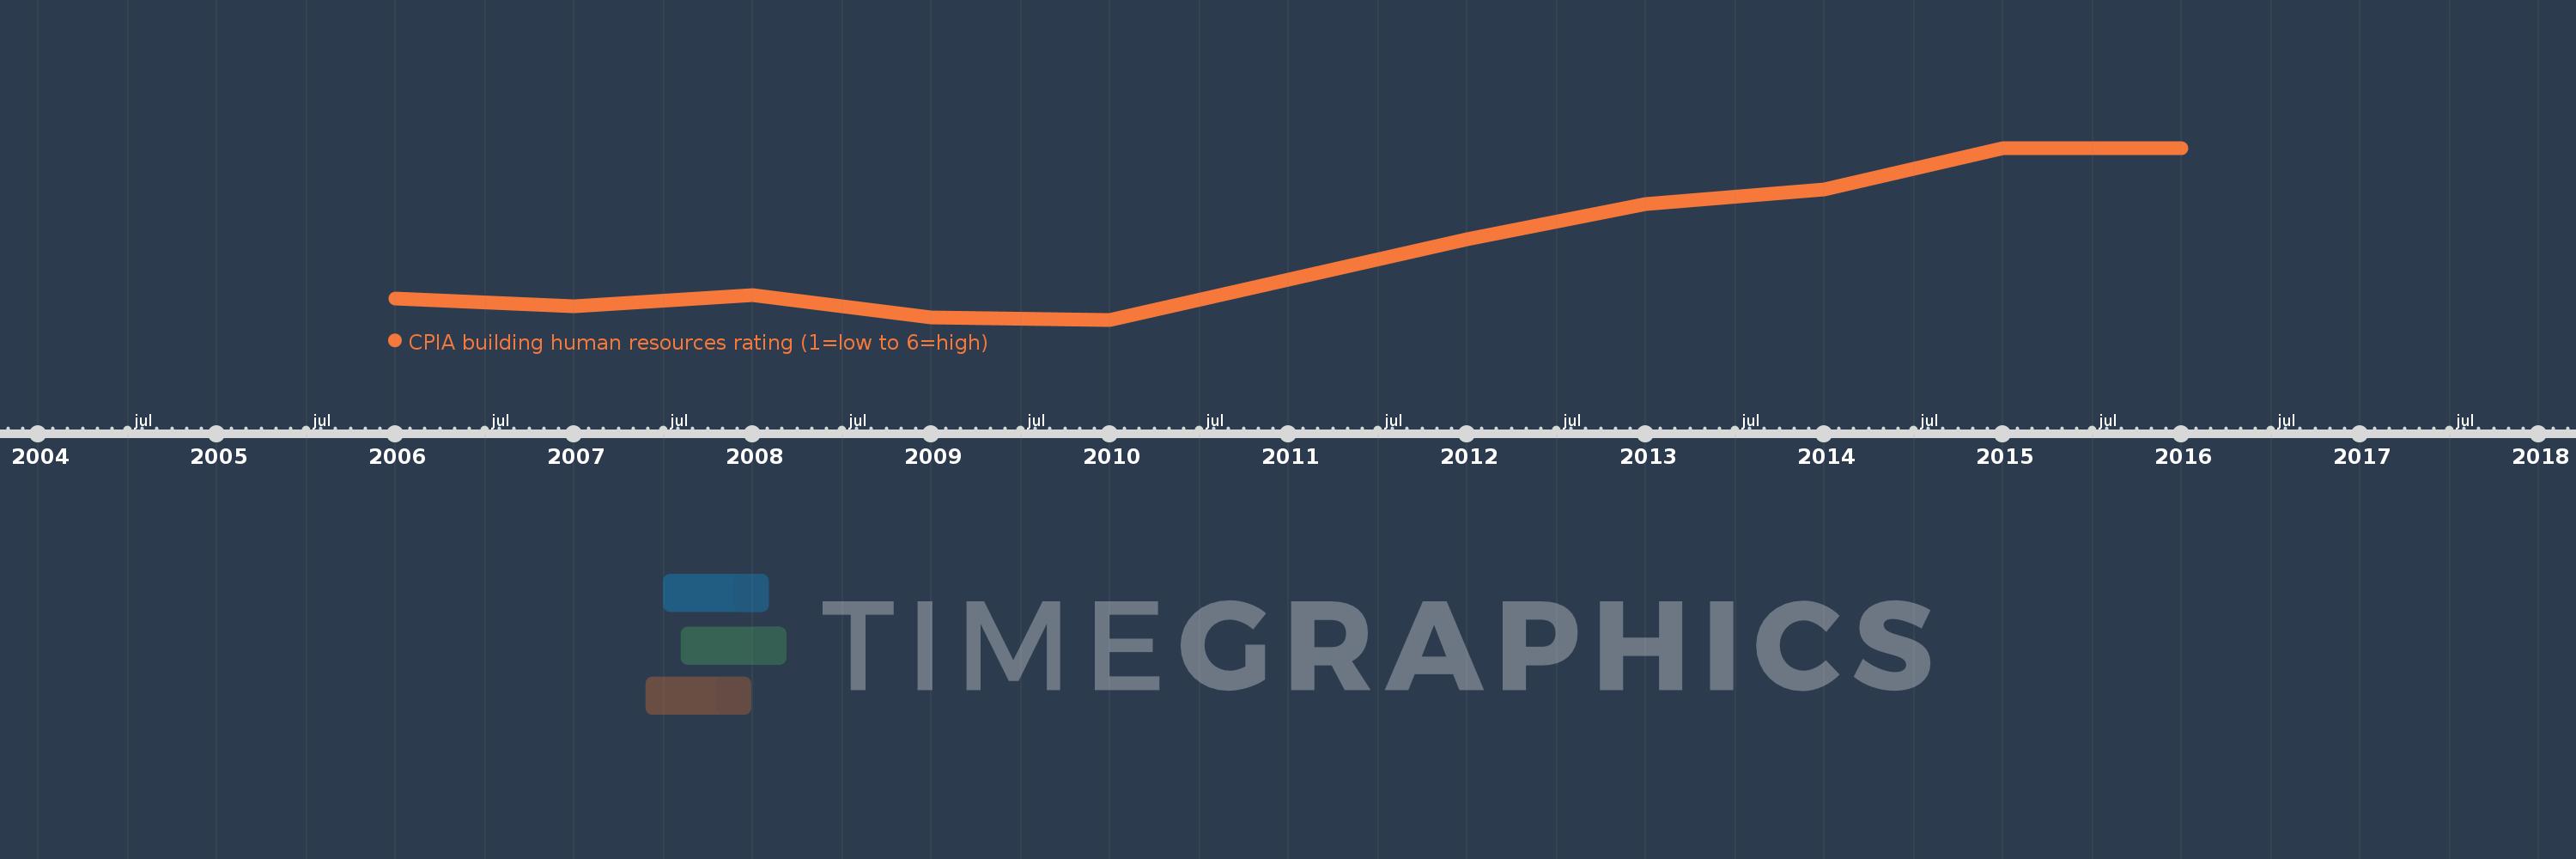
CPIA building human resources rating (1=low to 6=high)
2016,2015,2014,2013,2012,2011,2010,2009,2008,2007,2006
This statistics in other country:
Timeline:
This timeline shows a graph from 2006 to 2016 of Fragile and conflict affected situations. No data until 2005. Number of actual observations by date: 11.
Source name:
World Development Indicators
Source organization:
World Bank Group, CPIA database (http://www.worldbank.org/ida).
Categories, topics:
Public Sector
Last updated:
apr 23, 2017
Indicators value changes by year
At the date of observation
Value
Absolute change
Change from previous value
jan 1, 2006
2.857
+2.857
0.0%
jan 1, 2007
2.841
-0.016
-0.57%
jan 1, 2008
2.864
+0.023
0.8%
jan 1, 2009
2.818
-0.045
-1.59%
jan 1, 2010
2.813
-0.006
-0.2%
jan 1, 2011
2.896
+0.083
2.96%
jan 1, 2012
2.981
+0.085
2.93%
jan 1, 2013
3.054
+0.073
2.44%
jan 1, 2014
3.086
+0.033
1.07%
jan 1, 2015
3.172
+0.086
2.79%
jan 1, 2016
3.172
0.0
0.0%
Ranking of countries by current statistics by years


Comments: