29
/
en
AIzaSyAYiBZKx7MnpbEhh9jyipgxe19OcubqV5w
April 1, 2024
45170
Low & middle income
LMY
false
2
1
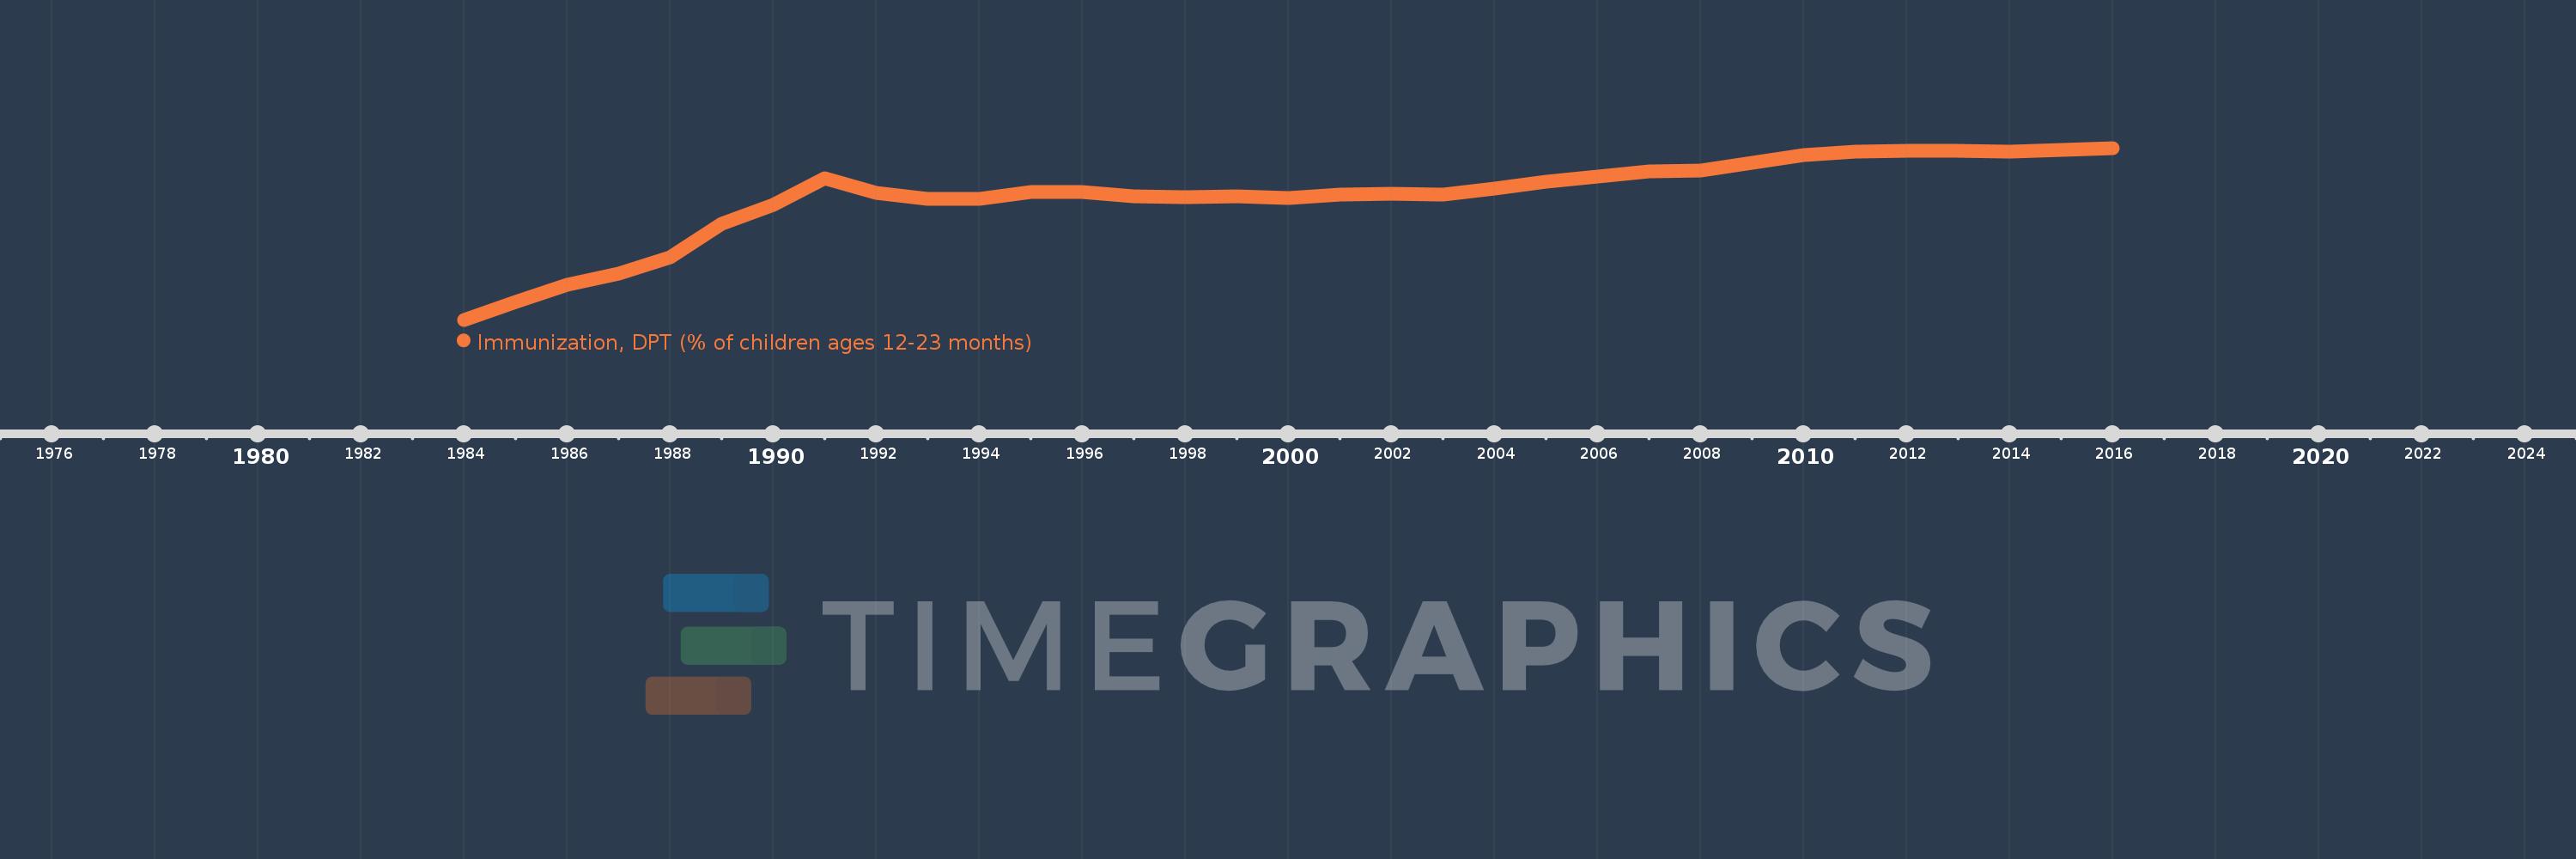
Immunization, DPT (% of children ages 12-23 months)
2016,2015,2014,2013,2012,2011,2010,2009,2008,2007,2006,2005,2004,2003,2002,2001,2000,1999,1998,1997,1996,1995,1994,1993,1992,1991,1990,1989,1988,1987,1986,1985,1984
This statistics in other country:
AfghanistanAlbaniaAlgeriaAndorraAngolaAntigua and BarbudaArab WorldArgentinaArmeniaAustraliaAustriaAzerbaijanBahamas, TheBahrainBangladeshBarbadosBelarusBelgiumBelizeBeninBhutanBoliviaBosnia and HerzegovinaBotswanaBrazilBrunei DarussalamBulgariaBurkina FasoBurundiCabo VerdeCambodiaCameroonCanadaCaribbean small statesCentral African RepublicCentral Europe and the BalticsChadChileChinaColombiaComorosCongo, Dem. Rep.Congo, Rep.Costa RicaCote d'IvoireCroatiaCubaCyprusCzech RepublicDenmarkDjiboutiDominicaDominican RepublicEarly-demographic dividendEast Asia & PacificEast Asia & Pacific (excluding high income)East Asia & Pacific (IDA & IBRD countries)EcuadorEgypt, Arab Rep.El SalvadorEquatorial GuineaEritreaEstoniaEthiopiaEuro areaEurope & Central AsiaEurope & Central Asia (excluding high income)Europe & Central Asia (IDA & IBRD countries)European UnionFijiFinlandFragile and conflict affected situationsFranceGabonGambia, TheGeorgiaGermanyGhanaGreeceGrenadaGuatemalaGuineaGuinea-BissauGuyanaHaitiHeavily indebted poor countries (HIPC)High incomeHondurasHungaryIBRD onlyIcelandIDA & IBRD totalIDA blendIDA onlyIDA totalIndiaIndonesiaIran, Islamic Rep.IraqIrelandIsraelItalyJamaicaJapanJordanKazakhstanKenyaKiribatiKorea, Dem. People’s Rep.Korea, Rep.KuwaitKyrgyz RepublicLao PDRLate-demographic dividendLatin America & Caribbean Latin America & Caribbean (excluding high income)Latin America & the Caribbean (IDA & IBRD countries)LatviaLeast developed countries: UN classificationLebanonLesothoLiberiaLibyaLithuaniaLow & middle incomeLow incomeLower middle incomeLuxembourgMacedonia, FYRMadagascarMalawiMalaysiaMaldivesMaliMaltaMarshall IslandsMauritaniaMauritiusMexicoMicronesia, Fed. Sts.Middle East & North AfricaMiddle East & North Africa (excluding high income)Middle East & North Africa (IDA & IBRD countries)Middle incomeMoldovaMonacoMongoliaMontenegroMoroccoMozambiqueMyanmarNamibiaNauruNepalNetherlandsNew ZealandNicaraguaNigerNigeriaNorth AmericaNorwayOECD membersOmanOther small statesPacific island small statesPakistanPalauPanamaPapua New GuineaParaguayPeruPhilippinesPolandPortugalPost-demographic dividendPre-demographic dividendQatarRomaniaRussian FederationRwandaSamoaSan MarinoSao Tome and PrincipeSaudi ArabiaSenegalSerbiaSeychellesSierra LeoneSingaporeSlovak RepublicSloveniaSmall statesSolomon IslandsSomaliaSouth AfricaSouth AsiaSouth Asia (IDA & IBRD)South SudanSpainSri LankaSt. Kitts and NevisSt. LuciaSt. Vincent and the GrenadinesSub-Saharan Africa Sub-Saharan Africa (excluding high income)Sub-Saharan Africa (IDA & IBRD countries)SudanSurinameSwazilandSwedenSwitzerlandSyrian Arab RepublicTajikistanTanzaniaThailandTimor-LesteTogoTongaTrinidad and TobagoTunisiaTurkeyTurkmenistanTuvaluUgandaUkraineUnited Arab EmiratesUnited KingdomUnited StatesUpper middle incomeUruguayUzbekistanVanuatuVenezuela, RBVietnamWorldYemen, Rep.ZambiaZimbabwe Timeline:
This timeline shows a graph from 1984 to 2016 of Low & middle income. No data until 1983. Number of actual observations by date: 33.
Source name:
World Development Indicators
Source organization:
WHO and UNICEF (http://www.who.int/immunization/monitoring_surveillance/en/).
Categories, topics:
Health
Last updated:
apr 23, 2017
Indicators value changes by year
Minimum:
32.478
jan 1, 1984
Maximum:
84.803
jan 1, 2016
At the date of observation
Value
Absolute change
Change from previous value
jan 1, 1984
32.478
+32.478
0.0%
jan 1, 1985
37.927
+5.449
16.78%
jan 1, 1986
43.135
+5.209
13.73%
jan 1, 1987
46.535
+3.4
7.88%
jan 1, 1988
51.458
+4.923
10.58%
jan 1, 1989
61.74
+10.282
19.98%
jan 1, 1990
67.337
+5.598
9.07%
jan 1, 1991
75.511
+8.173
12.14%
jan 1, 1992
71.075
-4.435
-5.87%
jan 1, 1993
69.256
-1.819
-2.56%
jan 1, 1994
69.217
-0.039
-0.06%
jan 1, 1995
71.347
+2.13
3.08%
jan 1, 1996
71.46
+0.113
0.16%
jan 1, 1997
70.013
-1.447
-2.03%
jan 1, 1998
69.719
-0.294
-0.42%
jan 1, 1999
69.96
+0.241
0.35%
jan 1, 2000
69.592
-0.368
-0.53%
jan 1, 2001
70.48
+0.888
1.28%
jan 1, 2002
70.892
+0.413
0.59%
jan 1, 2003
70.699
-0.194
-0.27%
jan 1, 2004
72.389
+1.69
2.39%
jan 1, 2005
74.454
+2.066
2.85%
jan 1, 2006
75.983
+1.529
2.05%
jan 1, 2007
77.575
+1.592
2.1%
jan 1, 2008
77.846
+0.271
0.35%
jan 1, 2009
80.16
+2.313
2.97%
jan 1, 2010
82.685
+2.526
3.15%
jan 1, 2011
83.638
+0.953
1.15%
jan 1, 2012
83.987
+0.349
0.42%
jan 1, 2013
83.954
-0.033
-0.04%
jan 1, 2014
83.739
-0.214
-0.26%
jan 1, 2015
84.272
+0.533
0.64%
jan 1, 2016
84.803
+0.531
0.63%
Ranking of countries by current statistics by years


Comments: