29
/
en
AIzaSyAYiBZKx7MnpbEhh9jyipgxe19OcubqV5w
April 1, 2024
39991
IDA total
IDA
false
2
1
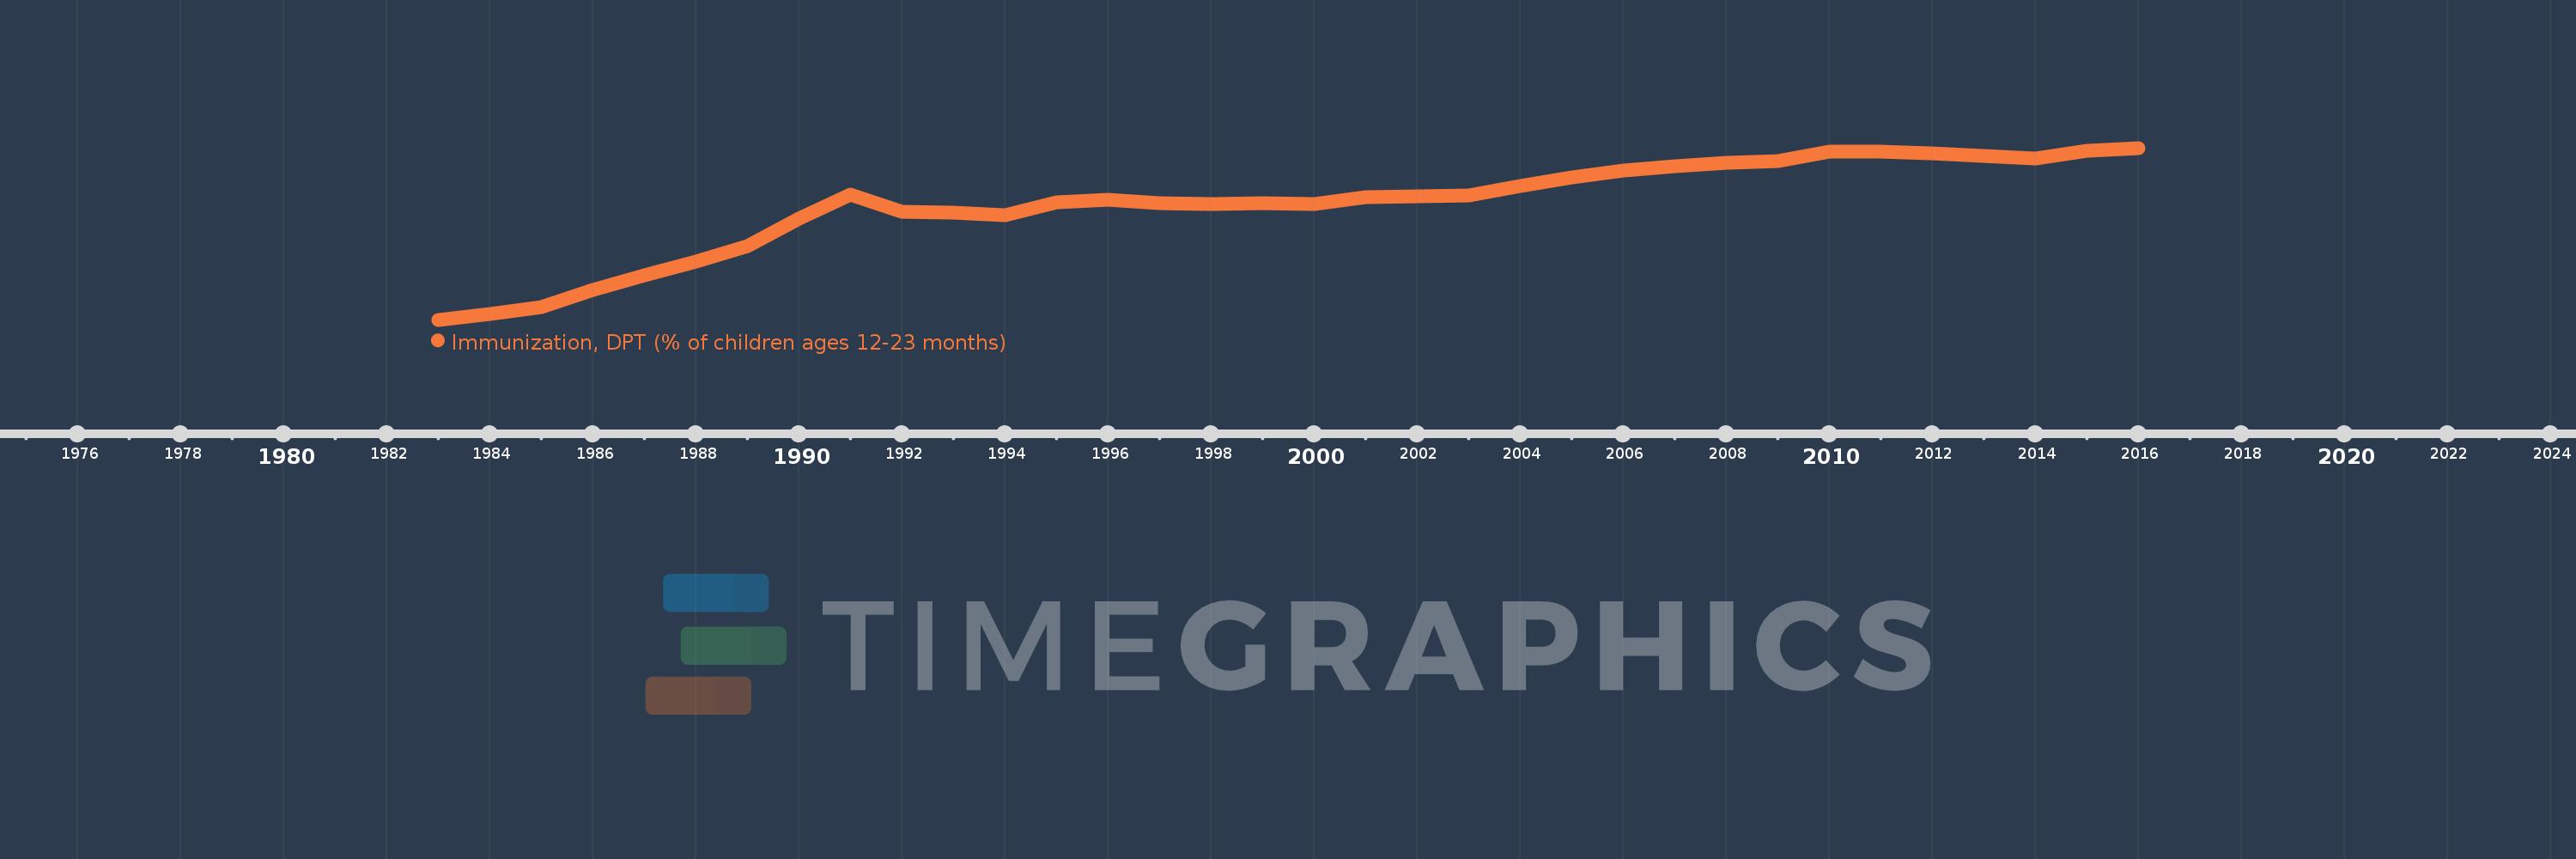
Immunization, DPT (% of children ages 12-23 months)
2016,2015,2014,2013,2012,2011,2010,2009,2008,2007,2006,2005,2004,2003,2002,2001,2000,1999,1998,1997,1996,1995,1994,1993,1992,1991,1990,1989,1988,1987,1986,1985,1984,1983
This statistics in other country:
AfghanistanAlbaniaAlgeriaAndorraAngolaAntigua and BarbudaArab WorldArgentinaArmeniaAustraliaAustriaAzerbaijanBahamas, TheBahrainBangladeshBarbadosBelarusBelgiumBelizeBeninBhutanBoliviaBosnia and HerzegovinaBotswanaBrazilBrunei DarussalamBulgariaBurkina FasoBurundiCabo VerdeCambodiaCameroonCanadaCaribbean small statesCentral African RepublicCentral Europe and the BalticsChadChileChinaColombiaComorosCongo, Dem. Rep.Congo, Rep.Costa RicaCote d'IvoireCroatiaCubaCyprusCzech RepublicDenmarkDjiboutiDominicaDominican RepublicEarly-demographic dividendEast Asia & PacificEast Asia & Pacific (excluding high income)East Asia & Pacific (IDA & IBRD countries)EcuadorEgypt, Arab Rep.El SalvadorEquatorial GuineaEritreaEstoniaEthiopiaEuro areaEurope & Central AsiaEurope & Central Asia (excluding high income)Europe & Central Asia (IDA & IBRD countries)European UnionFijiFinlandFragile and conflict affected situationsFranceGabonGambia, TheGeorgiaGermanyGhanaGreeceGrenadaGuatemalaGuineaGuinea-BissauGuyanaHaitiHeavily indebted poor countries (HIPC)High incomeHondurasHungaryIBRD onlyIcelandIDA & IBRD totalIDA blendIDA onlyIDA totalIndiaIndonesiaIran, Islamic Rep.IraqIrelandIsraelItalyJamaicaJapanJordanKazakhstanKenyaKiribatiKorea, Dem. People’s Rep.Korea, Rep.KuwaitKyrgyz RepublicLao PDRLate-demographic dividendLatin America & Caribbean Latin America & Caribbean (excluding high income)Latin America & the Caribbean (IDA & IBRD countries)LatviaLeast developed countries: UN classificationLebanonLesothoLiberiaLibyaLithuaniaLow & middle incomeLow incomeLower middle incomeLuxembourgMacedonia, FYRMadagascarMalawiMalaysiaMaldivesMaliMaltaMarshall IslandsMauritaniaMauritiusMexicoMicronesia, Fed. Sts.Middle East & North AfricaMiddle East & North Africa (excluding high income)Middle East & North Africa (IDA & IBRD countries)Middle incomeMoldovaMonacoMongoliaMontenegroMoroccoMozambiqueMyanmarNamibiaNauruNepalNetherlandsNew ZealandNicaraguaNigerNigeriaNorth AmericaNorwayOECD membersOmanOther small statesPacific island small statesPakistanPalauPanamaPapua New GuineaParaguayPeruPhilippinesPolandPortugalPost-demographic dividendPre-demographic dividendQatarRomaniaRussian FederationRwandaSamoaSan MarinoSao Tome and PrincipeSaudi ArabiaSenegalSerbiaSeychellesSierra LeoneSingaporeSlovak RepublicSloveniaSmall statesSolomon IslandsSomaliaSouth AfricaSouth AsiaSouth Asia (IDA & IBRD)South SudanSpainSri LankaSt. Kitts and NevisSt. LuciaSt. Vincent and the GrenadinesSub-Saharan Africa Sub-Saharan Africa (excluding high income)Sub-Saharan Africa (IDA & IBRD countries)SudanSurinameSwazilandSwedenSwitzerlandSyrian Arab RepublicTajikistanTanzaniaThailandTimor-LesteTogoTongaTrinidad and TobagoTunisiaTurkeyTurkmenistanTuvaluUgandaUkraineUnited Arab EmiratesUnited KingdomUnited StatesUpper middle incomeUruguayUzbekistanVanuatuVenezuela, RBVietnamWorldYemen, Rep.ZambiaZimbabwe Timeline:
This timeline shows a graph from 1983 to 2016 of IDA total. No data until 1982. Number of actual observations by date: 34.
Source name:
World Development Indicators
Source organization:
WHO and UNICEF (http://www.who.int/immunization/monitoring_surveillance/en/).
Categories, topics:
Health
Last updated:
apr 23, 2017
Indicators value changes by year
Minimum:
14.635
jan 1, 1983
Maximum:
78.309
jan 1, 2016
At the date of observation
Value
Absolute change
Change from previous value
jan 1, 1983
14.635
+14.635
0.0%
jan 1, 1984
16.803
+2.168
14.81%
jan 1, 1985
19.241
+2.438
14.51%
jan 1, 1986
25.839
+6.598
34.29%
jan 1, 1987
30.952
+5.113
19.79%
jan 1, 1988
36.053
+5.101
16.48%
jan 1, 1989
41.813
+5.761
15.98%
jan 1, 1990
52.095
+10.282
24.59%
jan 1, 1991
60.871
+8.776
16.85%
jan 1, 1992
54.528
-6.343
-10.42%
jan 1, 1993
54.182
-0.346
-0.63%
jan 1, 1994
53.341
-0.842
-1.55%
jan 1, 1995
58.138
+4.798
8.99%
jan 1, 1996
59.18
+1.042
1.79%
jan 1, 1997
57.7
-1.48
-2.5%
jan 1, 1998
57.404
-0.297
-0.51%
jan 1, 1999
57.981
+0.577
1.01%
jan 1, 2000
57.669
-0.312
-0.54%
jan 1, 2001
60.199
+2.53
4.39%
jan 1, 2002
60.374
+0.175
0.29%
jan 1, 2003
60.855
+0.481
0.8%
jan 1, 2004
64.139
+3.284
5.4%
jan 1, 2005
67.342
+3.203
4.99%
jan 1, 2006
69.829
+2.488
3.69%
jan 1, 2007
71.627
+1.798
2.57%
jan 1, 2008
72.742
+1.115
1.56%
jan 1, 2009
73.328
+0.586
0.81%
jan 1, 2010
77.041
+3.713
5.06%
jan 1, 2011
76.945
-0.096
-0.12%
jan 1, 2012
76.343
-0.602
-0.78%
jan 1, 2013
75.443
-0.9
-1.18%
jan 1, 2014
74.372
-1.071
-1.42%
jan 1, 2015
77.1
+2.728
3.67%
jan 1, 2016
78.309
+1.209
1.57%
Ranking of countries by current statistics by years


Comments: