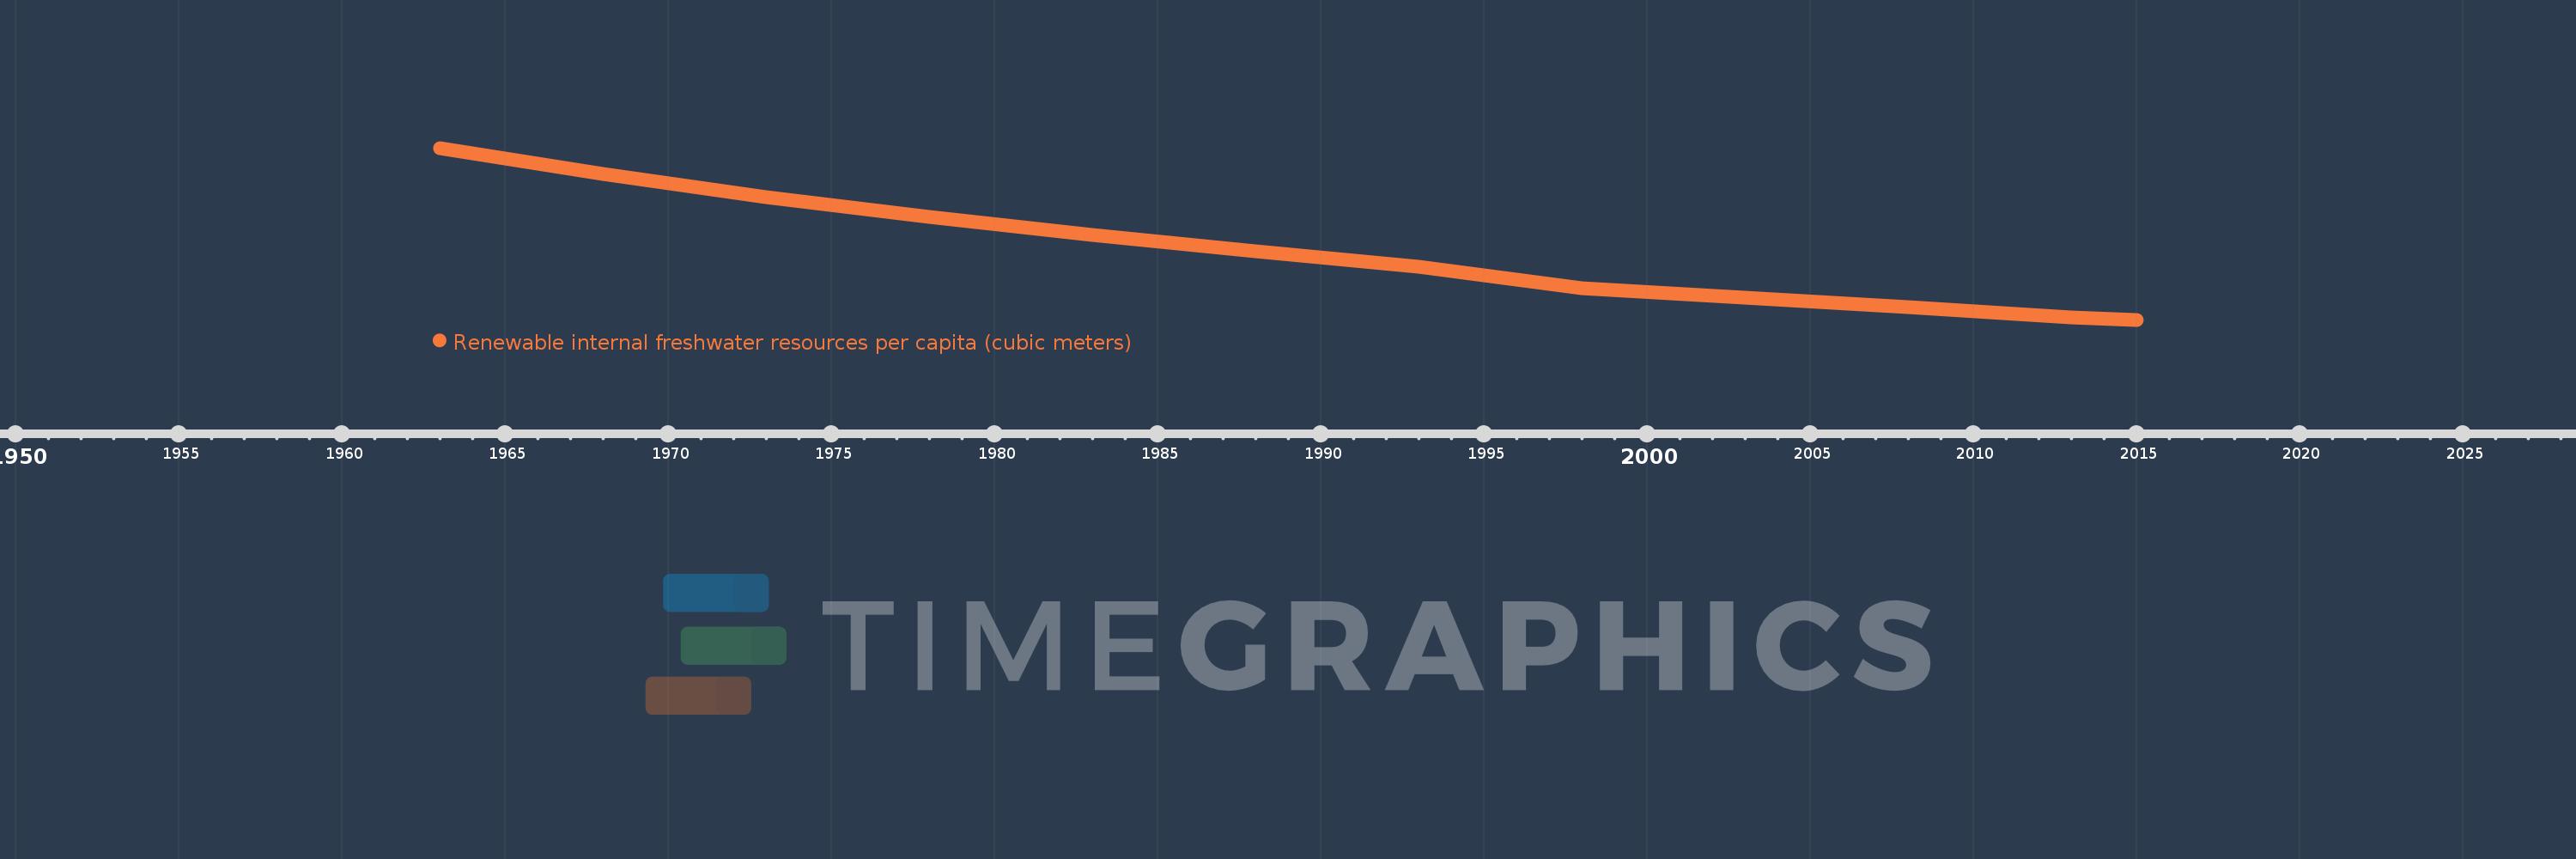
This timeline shows a graph from 1963 to 2015 of Least developed countries: UN classification. No data until 1962. Number of actual observations by date: 12.
Source name:
World Development Indicators
Source organization:
Food and Agriculture Organization, AQUASTAT data.
Categories, topics:
Infrastructure, Environment
Last updated:
apr 23, 2017
Indicators value changes by year
Meaning:
11.205K
Minimum:
4.964K
jan 1, 2015
Maximum:
20.7K
jan 1, 1963
At the date of observation
Value
Absolute change
Change from the previous value
jan 1, 1963
20.7K
+20.7K
0.0%
jan 1, 1968
18.287K
-2.413K
-11.66%
jan 1, 1973
16.199K
-2.088K
-11.42%
jan 1, 1978
14.403K
-1.796K
-11.09%
jan 1, 1983
12.701K
-1.702K
-11.82%
jan 1, 1988
11.211K
-1.49K
-11.73%
jan 1, 1993
9.822K
-1.388K
-12.38%
jan 1, 1998
7.872K
-1.951K
-19.86%
jan 1, 2003
6.947K
-924.635
-11.75%
jan 1, 2008
6.152K
-795.378
-11.45%
jan 1, 2013
5.206K
-945.995
-15.38%
jan 1, 2015
4.964K
-242.148
-4.65%
Ranking of countries by current statistics by years
