30
/
AIzaSyAYiBZKx7MnpbEhh9jyipgxe19OcubqV5w
April 1, 2024
43842
Latin America & the Caribbean (IDA & IBRD countries)
TLA
false
2
1
Renewable internal freshwater resources per capita (cubic meters)
2015,2013,2008,2003,1998,1993,1988,1983,1978,1973,1968,1963
Download
Global statistics library →Latin America & the Caribbean (IDA & IBRD countries) →

Renewable internal freshwater resources per capita (cubic meters)

This statistics in other country:

AfghanistanAlbaniaAlgeriaAndorraAngolaAntigua and BarbudaArab WorldArgentinaArmeniaAustraliaAustriaAzerbaijanBahamas, TheBahrainBangladeshBarbadosBelarusBelgiumBelizeBeninBhutanBoliviaBosnia and HerzegovinaBotswanaBrazilBrunei DarussalamBulgariaBurkina FasoBurundiCabo VerdeCambodiaCameroonCanadaCaribbean small statesCentral African RepublicCentral Europe and the BalticsChadChileChinaColombiaComorosCongo, Dem. Rep.Congo, Rep.Costa RicaCote d'IvoireCroatiaCubaCyprusCzech RepublicDenmarkDjiboutiDominicaDominican RepublicEarly-demographic dividendEast Asia & PacificEast Asia & Pacific (excluding high income)East Asia & Pacific (IDA & IBRD countries)EcuadorEgypt, Arab Rep.El SalvadorEquatorial GuineaEritreaEstoniaEthiopiaEuro areaEurope & Central AsiaEurope & Central Asia (excluding high income)Europe & Central Asia (IDA & IBRD countries)European UnionFijiFinlandFragile and conflict affected situationsFranceFrench PolynesiaGabonGambia, TheGeorgiaGermanyGhanaGreeceGreenlandGrenadaGuatemalaGuineaGuinea-BissauGuyanaHaitiHeavily indebted poor countries (HIPC)High incomeHondurasHungaryIBRD onlyIcelandIDA & IBRD totalIDA blendIDA onlyIDA totalIndiaIndonesiaIran, Islamic Rep.IraqIrelandIsraelItalyJamaicaJapanJordanKazakhstanKenyaKorea, Dem. People’s Rep.Korea, Rep.KuwaitKyrgyz RepublicLao PDRLate-demographic dividendLatin America & Caribbean Latin America & Caribbean (excluding high income)Latin America & the Caribbean (IDA & IBRD countries)LatviaLeast developed countries: UN classificationLebanonLesothoLiberiaLibyaLithuaniaLow & middle incomeLow incomeLower middle incomeLuxembourgMacedonia, FYRMadagascarMalawiMalaysiaMaldivesMaliMaltaMauritaniaMauritiusMexicoMiddle East & North AfricaMiddle East & North Africa (excluding high income)Middle East & North Africa (IDA & IBRD countries)Middle incomeMoldovaMongoliaMoroccoMozambiqueMyanmarNamibiaNepalNetherlandsNew ZealandNicaraguaNigerNigeriaNorth AmericaNorwayOECD membersOmanOther small statesPacific island small statesPakistanPanamaPapua New GuineaParaguayPeruPhilippinesPolandPortugalPost-demographic dividendPre-demographic dividendPuerto RicoQatarRomaniaRussian FederationRwandaSao Tome and PrincipeSaudi ArabiaSenegalSerbiaSierra LeoneSingaporeSlovak RepublicSloveniaSmall statesSolomon IslandsSomaliaSouth AfricaSouth AsiaSouth Asia (IDA & IBRD)South SudanSpainSri LankaSt. Kitts and NevisSt. LuciaSt. Vincent and the GrenadinesSub-Saharan Africa Sub-Saharan Africa (excluding high income)Sub-Saharan Africa (IDA & IBRD countries)SudanSurinameSwazilandSwedenSwitzerlandSyrian Arab RepublicTajikistanTanzaniaThailandTimor-LesteTogoTrinidad and TobagoTunisiaTurkeyTurkmenistanUgandaUkraineUnited Arab EmiratesUnited KingdomUnited StatesUpper middle incomeUruguayUzbekistanVanuatuVenezuela, RBVietnamWest Bank and GazaWorldYemen, Rep.ZambiaZimbabwe

Timeline:

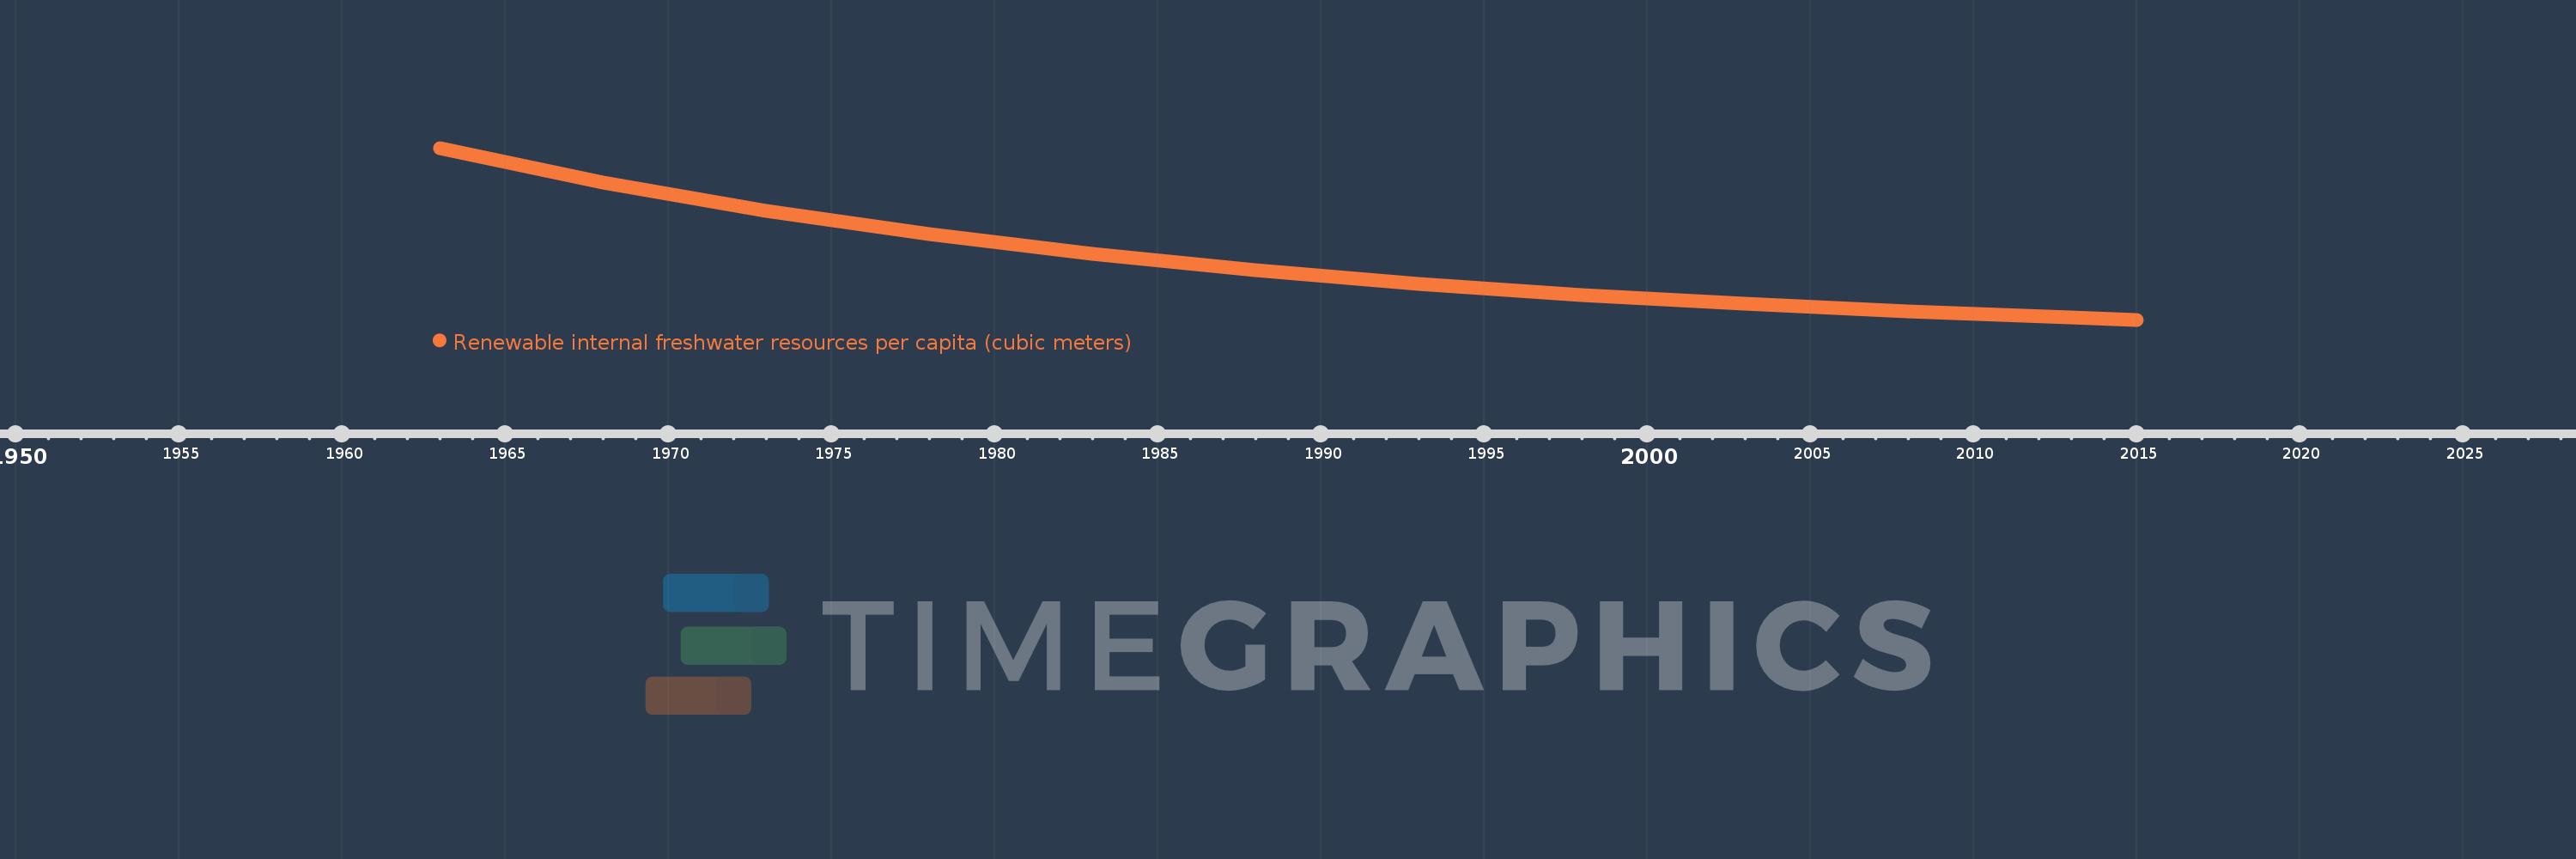
This timeline shows a graph from 1963 to 2015 of Latin America & the Caribbean (IDA & IBRD countries). No data until 1962. Number of actual observations by date: 12.

Source name:

World Development Indicators

Source organization:

Food and Agriculture Organization, AQUASTAT data.

Categories, topics:

Infrastructure, Environment

Last updated:

apr 23, 2017

Indicators value changes by year

Meaning:
36.165K
Minimum:
22.653K
jan 1, 2015
Maximum:
62.067K
jan 1, 1963
At the date of observation
Value
Absolute change
Change from the previous value
jan 1, 1963
62.067K
+62.067K
0.0%
jan 1, 1968
54.158K
-7.909K
-12.74%
jan 1, 1973
47.687K
-6.471K
-11.95%
jan 1, 1978
42.259K
-5.428K
-11.38%
jan 1, 1983
37.719K
-4.541K
-10.74%
jan 1, 1988
33.968K
-3.751K
-9.94%
jan 1, 1993
30.924K
-3.044K
-8.96%
jan 1, 1998
28.402K
-2.522K
-8.16%
jan 1, 2003
26.335K
-2.066K
-7.28%
jan 1, 2008
24.635K
-1.7K
-6.46%
jan 1, 2013
23.173K
-1.462K
-5.94%
jan 1, 2015
22.653K
-519.795
-2.24%

Ranking of countries by current statistics by years