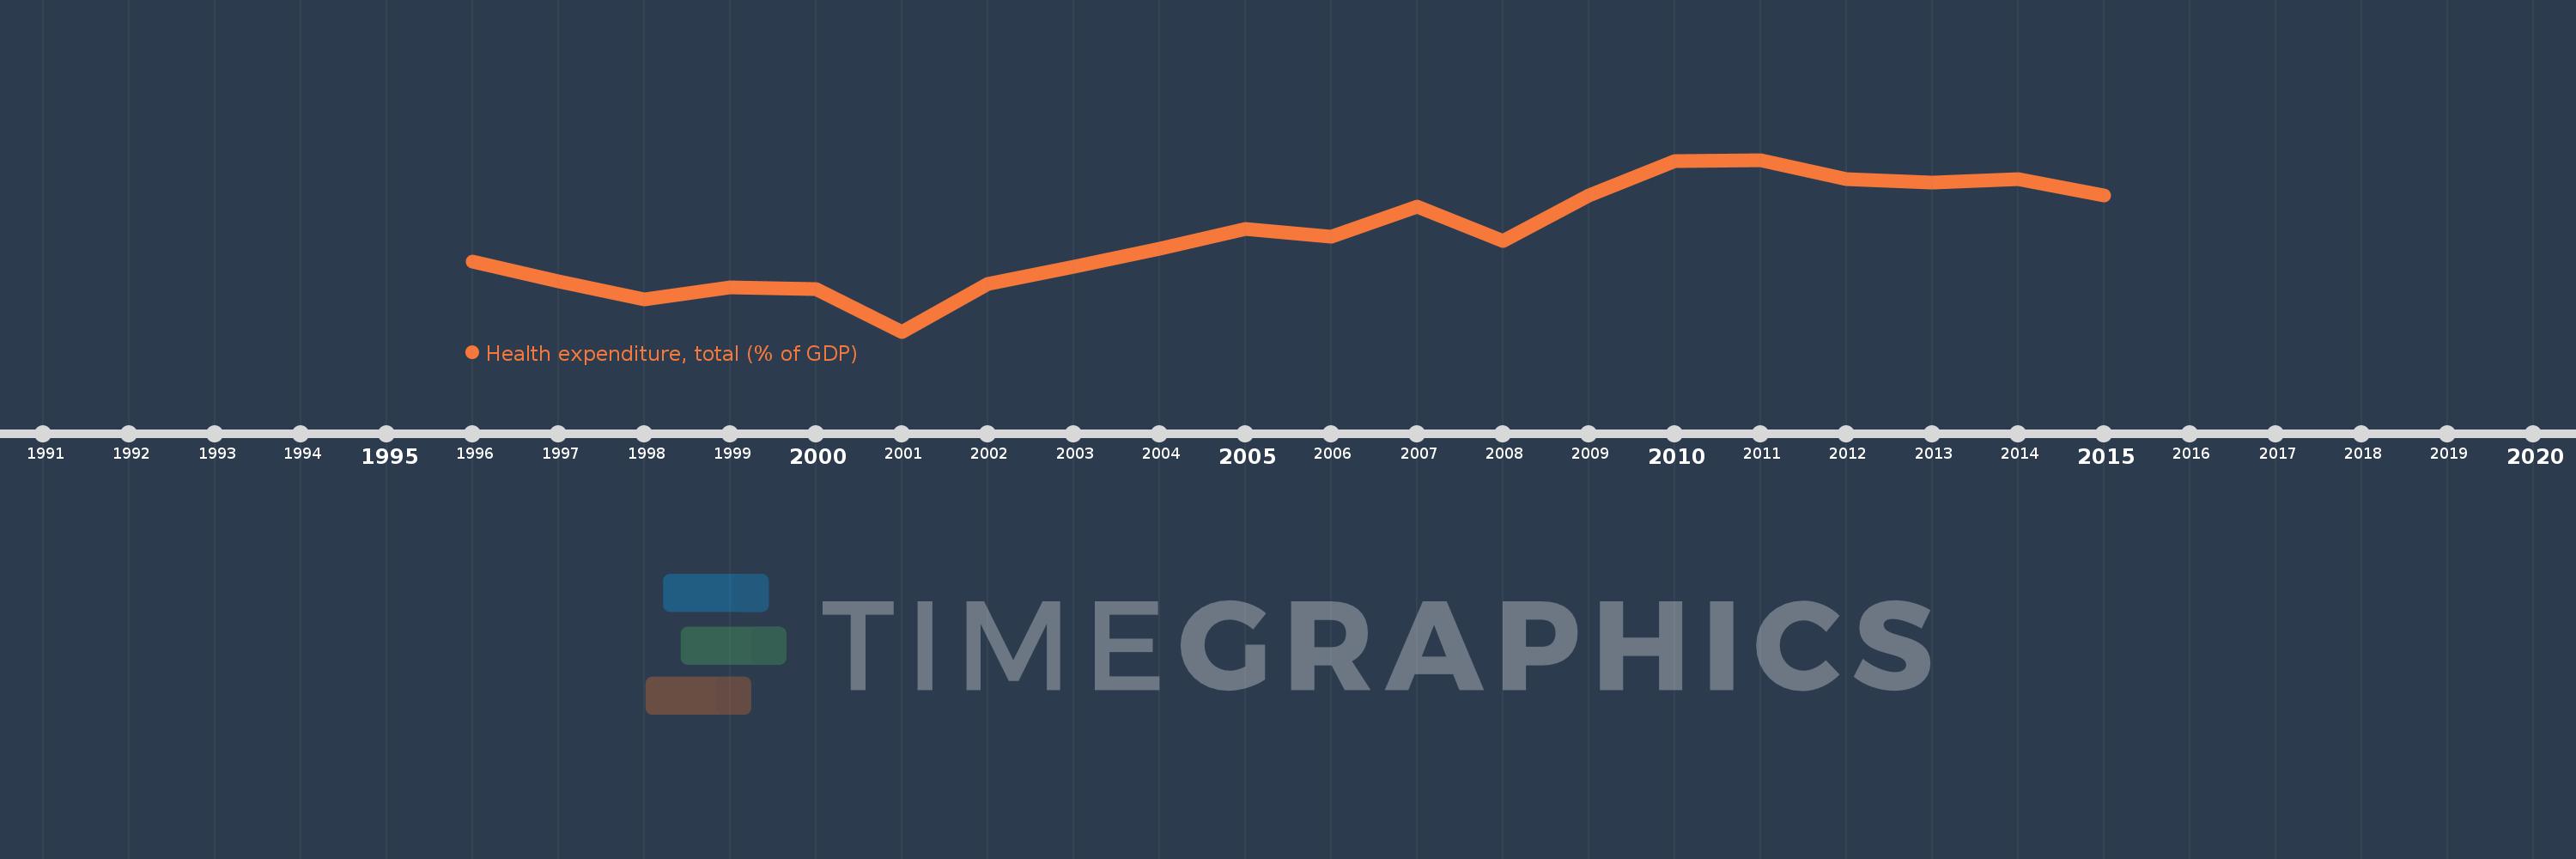
This timeline shows a graph from 1996 to 2015 of Least developed countries: UN classification. No data until 1995. Number of actual observations by date: 20.
Source name:
World Development Indicators
Source organization:
World Health Organization Global Health Expenditure database (see http://apps.who.int/nha/database for the most recent updates).
Categories, topics:
Health
Last updated:
apr 23, 2017
Indicators value changes by year
Meaning:
4.4
Minimum:
3.571
jan 1, 2001
Maximum:
5.057
jan 1, 2011
At the date of observation
Value
Absolute change
Change from the previous value
jan 1, 1996
4.179
+4.179
0.0%
jan 1, 1997
4.007
-0.171
-4.1%
jan 1, 1998
3.848
-0.16
-3.98%
jan 1, 1999
3.957
+0.109
2.84%
jan 1, 2000
3.942
-0.015
-0.38%
jan 1, 2001
3.571
-0.371
-9.41%
jan 1, 2002
3.981
+0.41
11.5%
jan 1, 2003
4.129
+0.148
3.71%
jan 1, 2004
4.291
+0.162
3.92%
jan 1, 2005
4.457
+0.166
3.88%
jan 1, 2006
4.393
-0.065
-1.45%
jan 1, 2007
4.654
+0.261
5.95%
jan 1, 2008
4.358
-0.296
-6.36%
jan 1, 2009
4.748
+0.39
8.95%
jan 1, 2010
5.047
+0.299
6.31%
jan 1, 2011
5.057
+0.01
0.2%
jan 1, 2012
4.887
-0.17
-3.36%
jan 1, 2013
4.859
-0.029
-0.59%
jan 1, 2014
4.892
+0.034
0.7%
jan 1, 2015
4.751
-0.141
-2.89%
Ranking of countries by current statistics by years
