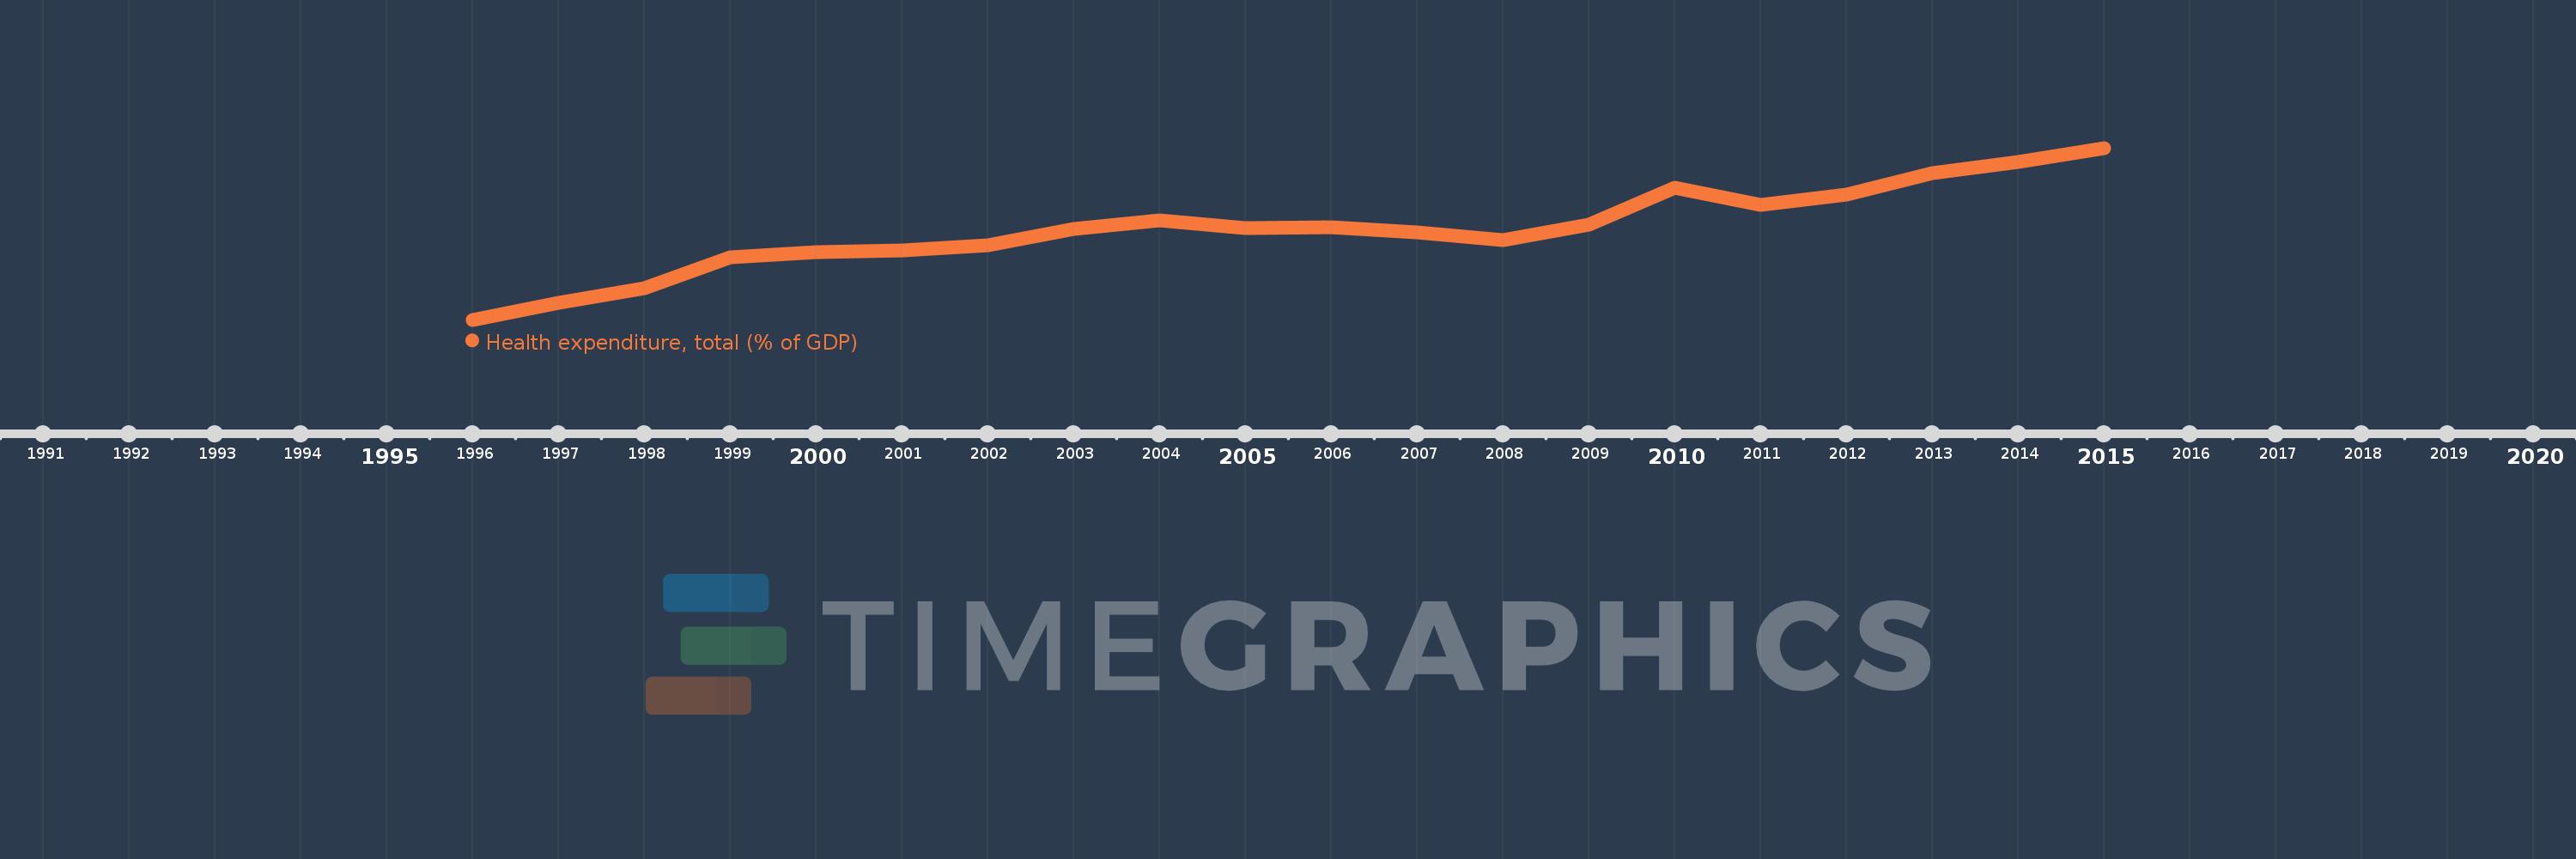
This timeline shows a graph from 1996 to 2015 of East Asia & Pacific (excluding high income). No data until 1995. Number of actual observations by date: 20.
Source name:
World Development Indicators
Source organization:
World Health Organization Global Health Expenditure database (see http://apps.who.int/nha/database for the most recent updates).
Categories, topics:
Health
Last updated:
apr 23, 2017
Indicators value changes by year
Meaning:
4.377
Minimum:
3.314
jan 1, 1996
Maximum:
5.334
jan 1, 2015
At the date of observation
Value
Absolute change
Change from the previous value
jan 1, 1996
3.314
+3.314
0.0%
jan 1, 1997
3.518
+0.204
6.17%
jan 1, 1998
3.682
+0.164
4.67%
jan 1, 1999
4.052
+0.369
10.03%
jan 1, 2000
4.104
+0.053
1.31%
jan 1, 2001
4.133
+0.028
0.69%
jan 1, 2002
4.189
+0.056
1.35%
jan 1, 2003
4.386
+0.197
4.7%
jan 1, 2004
4.482
+0.096
2.19%
jan 1, 2005
4.396
-0.086
-1.91%
jan 1, 2006
4.405
+0.009
0.21%
jan 1, 2007
4.338
-0.067
-1.53%
jan 1, 2008
4.246
-0.092
-2.11%
jan 1, 2009
4.432
+0.185
4.36%
jan 1, 2010
4.867
+0.435
9.82%
jan 1, 2011
4.663
-0.204
-4.19%
jan 1, 2012
4.789
+0.127
2.71%
jan 1, 2013
5.043
+0.254
5.29%
jan 1, 2014
5.172
+0.129
2.56%
jan 1, 2015
5.334
+0.162
3.13%
Ranking of countries by current statistics by years
