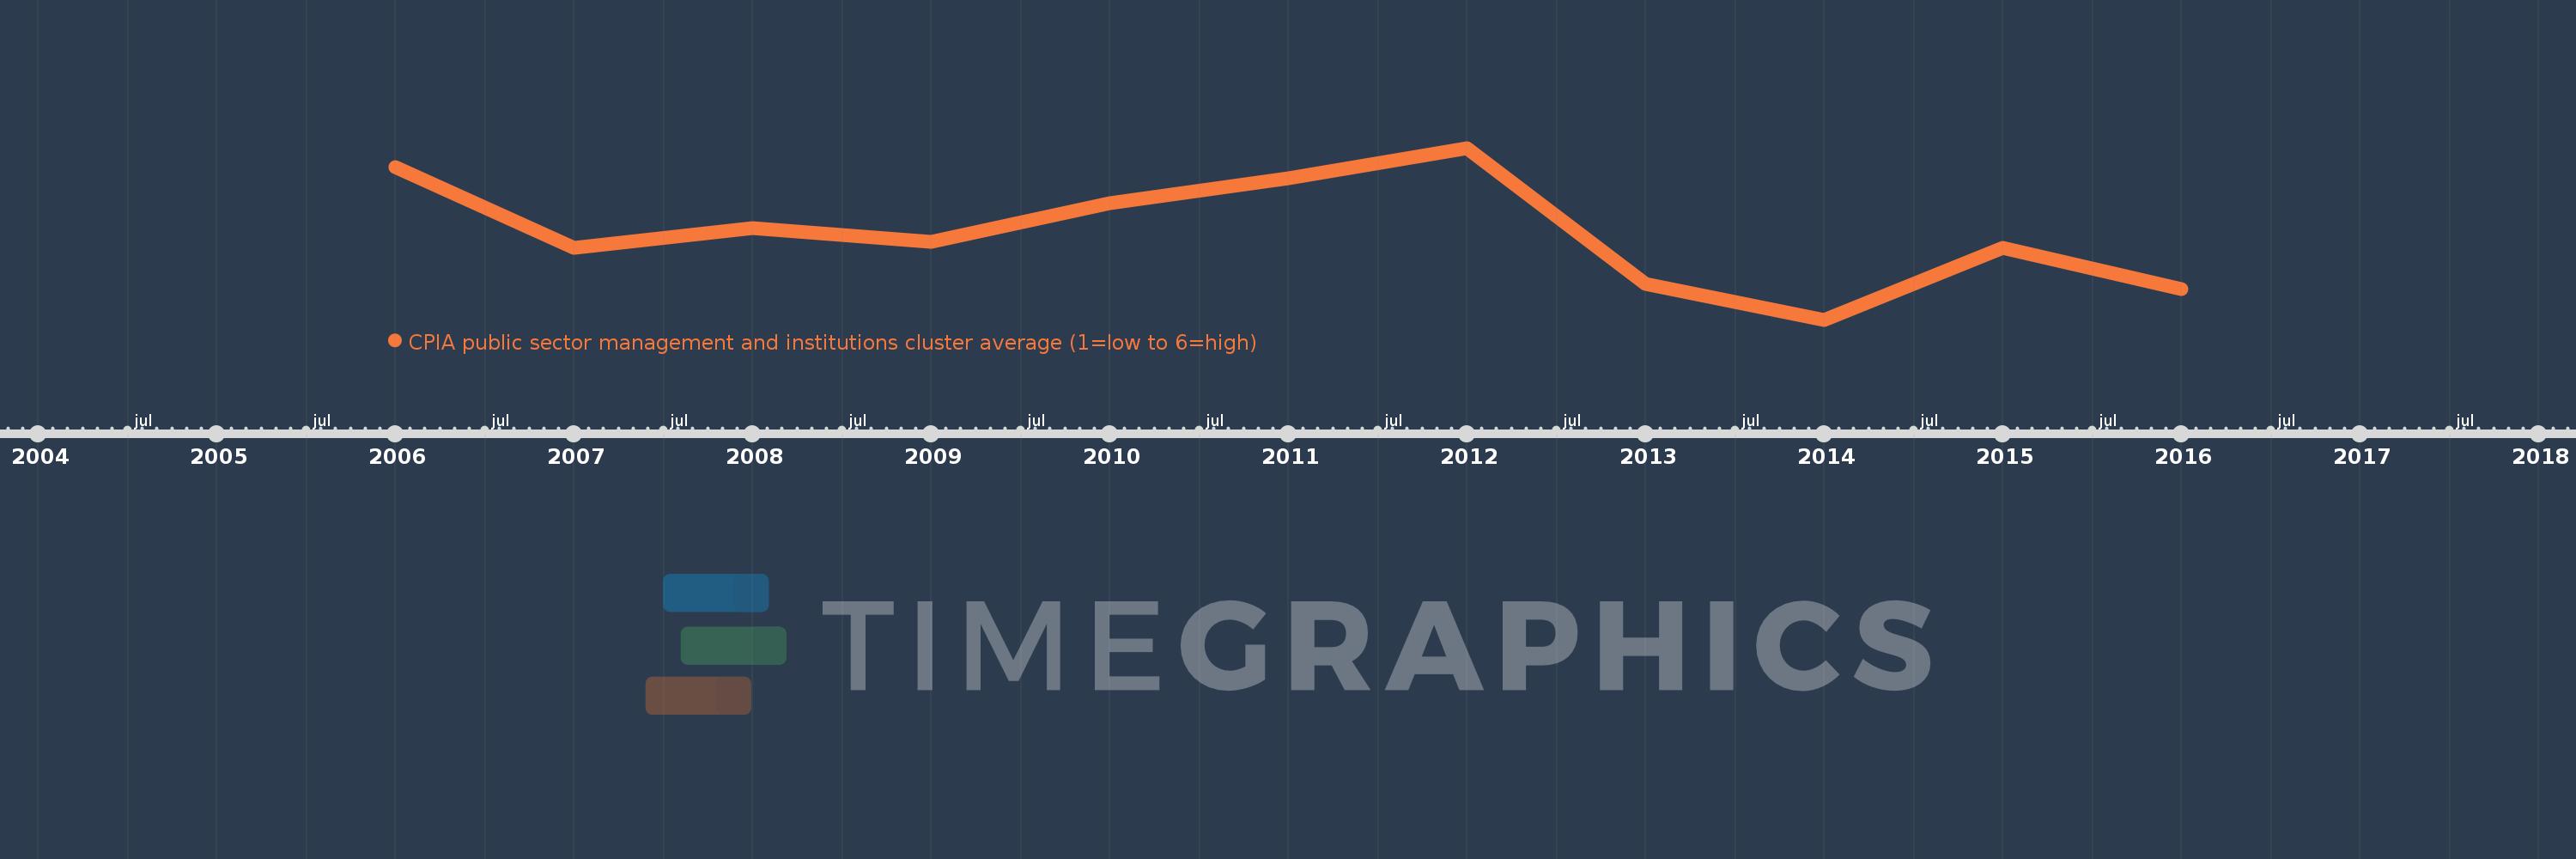
This timeline shows a graph from 2006 to 2016 of Least developed countries: UN classification. No data until 2005. Number of actual observations by date: 11.
Source name:
World Development Indicators
Source organization:
World Bank Group, CPIA database (http://www.worldbank.org/ida).
Categories, topics:
Climate Change, Public Sector
Last updated:
apr 23, 2017
Indicators value changes by year
Meaning:
2.93
Minimum:
2.898
jan 1, 2014
Maximum:
2.96
jan 1, 2012
At the date of observation
Value
Absolute change
Change from the previous value
jan 1, 2006
2.953
+2.953
0.0%
jan 1, 2007
2.924
-0.029
-0.97%
jan 1, 2008
2.931
+0.007
0.24%
jan 1, 2009
2.926
-0.005
-0.16%
jan 1, 2010
2.94
+0.013
0.46%
jan 1, 2011
2.949
+0.009
0.32%
jan 1, 2012
2.96
+0.012
0.39%
jan 1, 2013
2.911
-0.049
-1.67%
jan 1, 2014
2.898
-0.013
-0.46%
jan 1, 2015
2.924
+0.027
0.92%
jan 1, 2016
2.909
-0.016
-0.53%
Ranking of countries by current statistics by years
