29
/
en
AIzaSyAYiBZKx7MnpbEhh9jyipgxe19OcubqV5w
April 1, 2024
28974
East Asia & Pacific (IDA & IBRD countries)
TEA
false
2
1
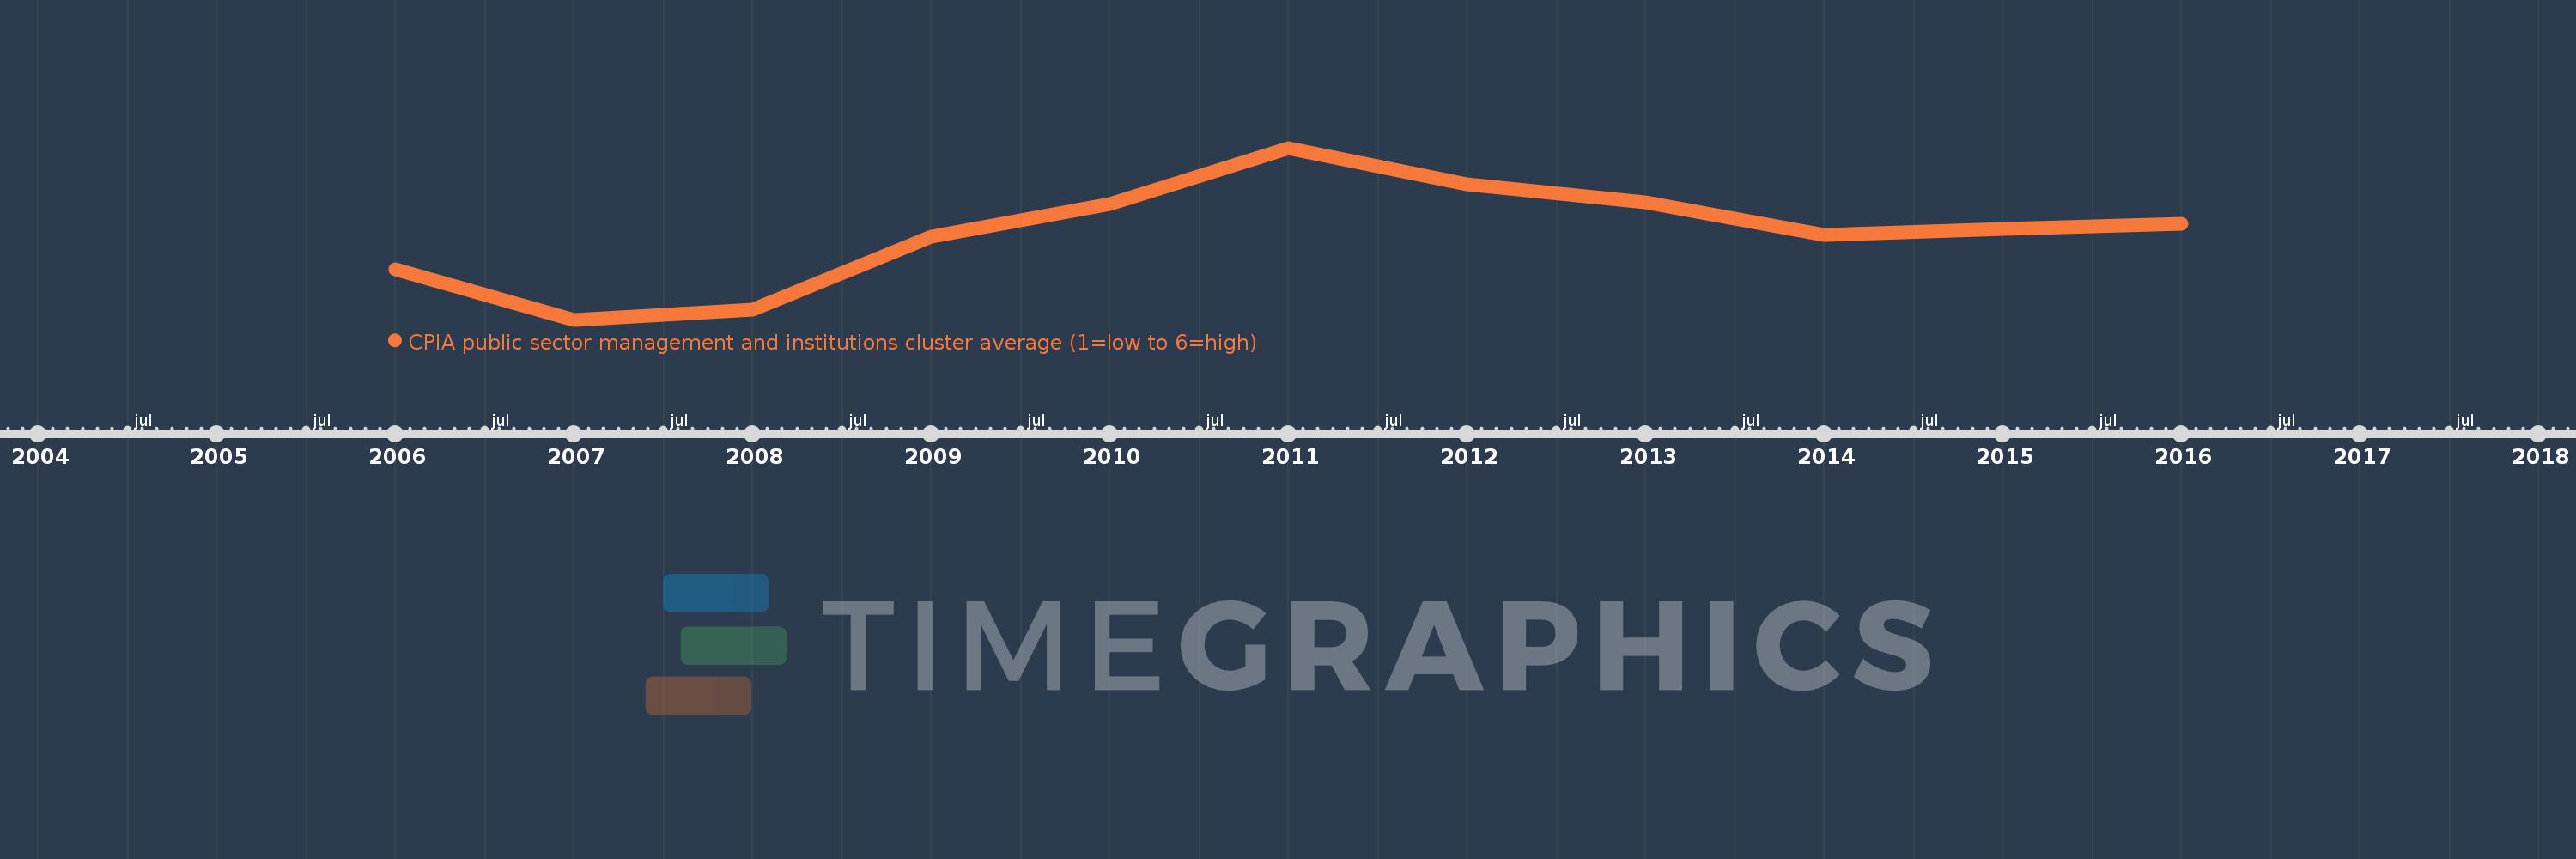
CPIA public sector management and institutions cluster average (1=low to 6=high)
2016,2015,2014,2013,2012,2011,2010,2009,2008,2007,2006
This statistics in other country:
Timeline:
This timeline shows a graph from 2006 to 2016 of East Asia & Pacific (IDA & IBRD countries). No data until 2005. Number of actual observations by date: 11.
Source name:
World Development Indicators
Source organization:
World Bank Group, CPIA database (http://www.worldbank.org/ida).
Categories, topics:
Climate Change, Public Sector
Last updated:
apr 23, 2017
Indicators value changes by year
At the date of observation
Value
Absolute change
Change from previous value
jan 1, 2006
3.082
+3.082
0.0%
jan 1, 2007
3.025
-0.057
-1.84%
jan 1, 2008
3.036
+0.011
0.38%
jan 1, 2009
3.118
+0.082
2.69%
jan 1, 2010
3.155
+0.036
1.17%
jan 1, 2011
3.218
+0.064
2.02%
jan 1, 2012
3.177
-0.041
-1.28%
jan 1, 2013
3.157
-0.02
-0.62%
jan 1, 2014
3.12
-0.037
-1.18%
jan 1, 2015
3.127
+0.007
0.21%
jan 1, 2016
3.133
+0.007
0.21%
Ranking of countries by current statistics by years


Comments: