29
/
en
AIzaSyAYiBZKx7MnpbEhh9jyipgxe19OcubqV5w
April 1, 2024
44142
Least developed countries: UN classification
LDC
false
2
1
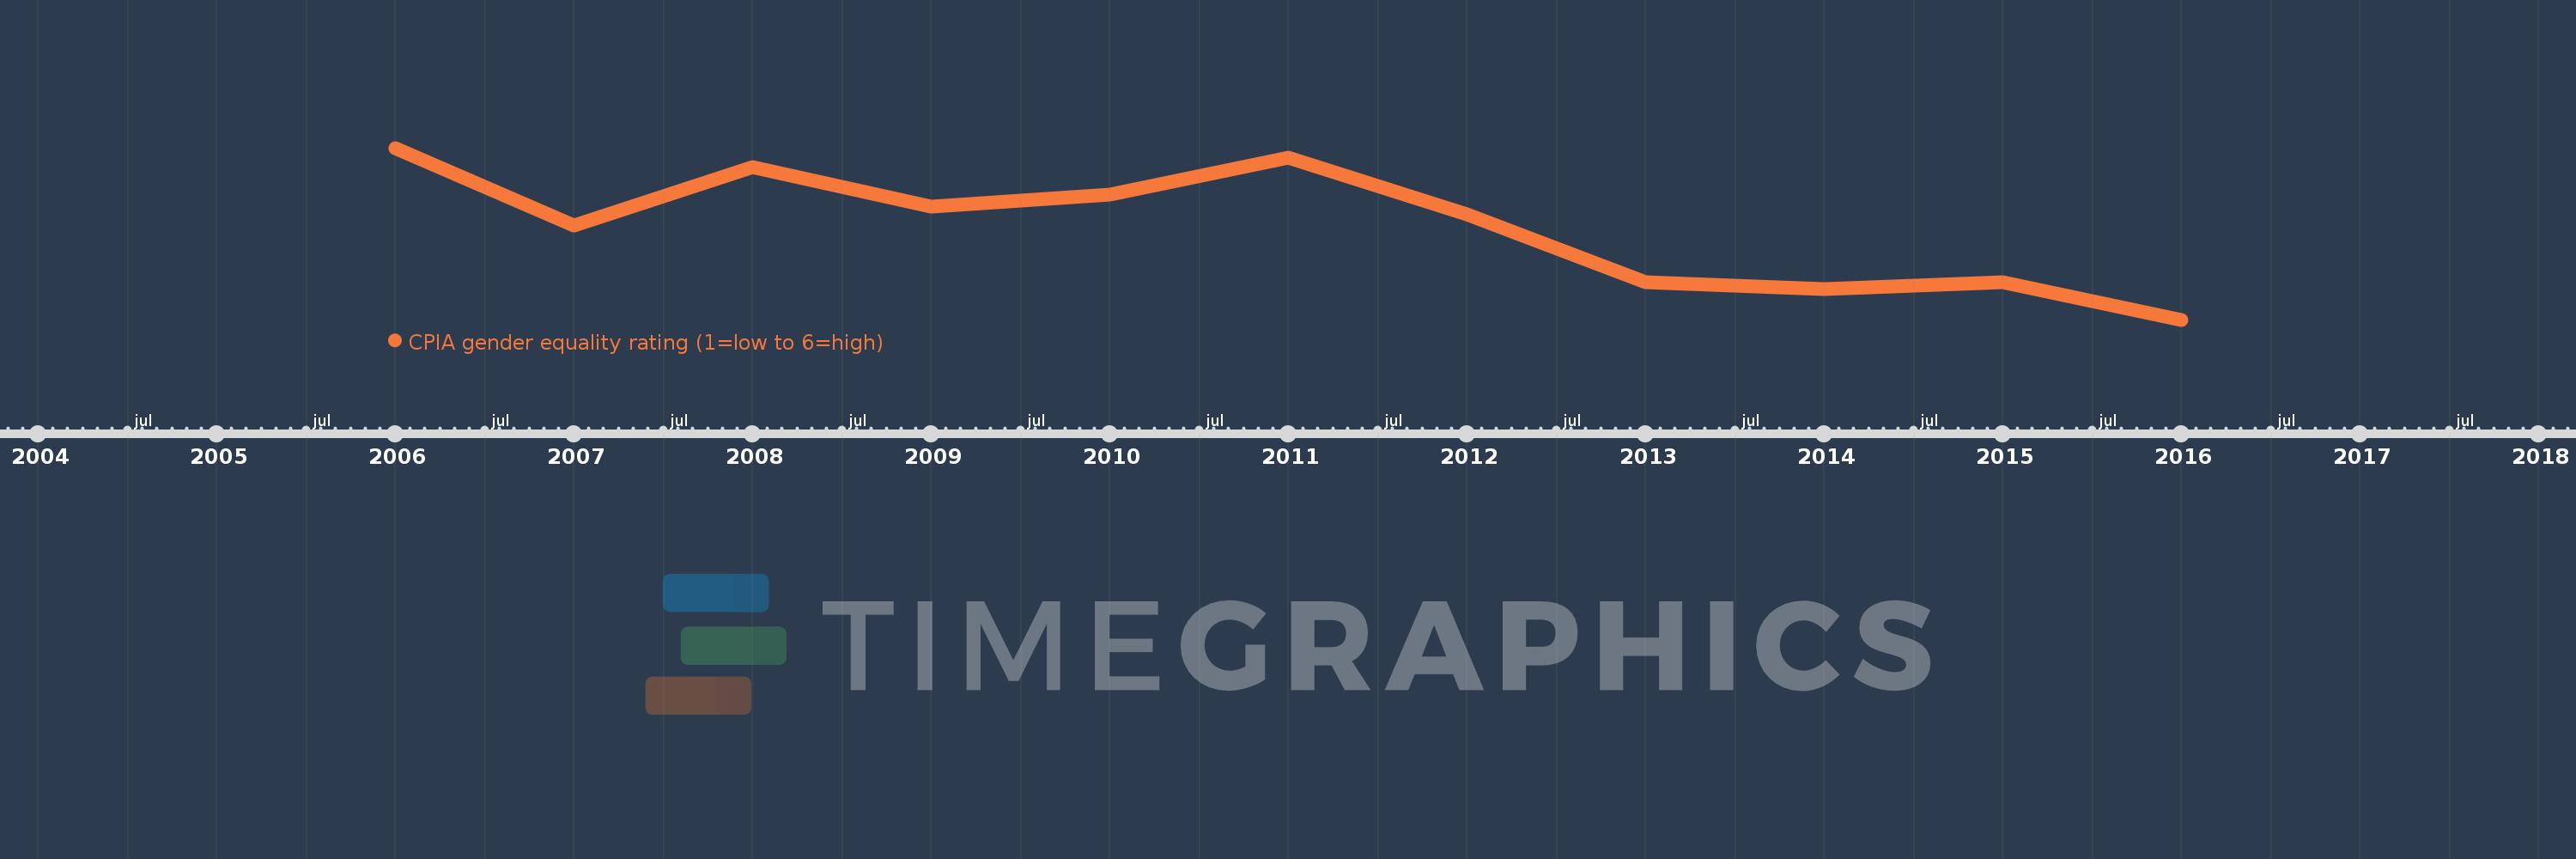
CPIA gender equality rating (1=low to 6=high)
2016,2015,2014,2013,2012,2011,2010,2009,2008,2007,2006
This statistics in other country:
Timeline:
This timeline shows a graph from 2006 to 2016 of Least developed countries: UN classification. No data until 2005. Number of actual observations by date: 11.
Source name:
World Development Indicators
Source organization:
World Bank Group, CPIA database (http://www.worldbank.org/ida).
Categories, topics:
Public Sector
Last updated:
apr 23, 2017
Indicators value changes by year
At the date of observation
Value
Absolute change
Change from previous value
jan 1, 2006
3.25
+3.25
0.0%
jan 1, 2007
3.202
-0.048
-1.47%
jan 1, 2008
3.238
+0.036
1.12%
jan 1, 2009
3.214
-0.024
-0.74%
jan 1, 2010
3.221
+0.007
0.21%
jan 1, 2011
3.244
+0.023
0.72%
jan 1, 2012
3.209
-0.035
-1.08%
jan 1, 2013
3.167
-0.043
-1.33%
jan 1, 2014
3.163
-0.004
-0.11%
jan 1, 2015
3.167
+0.004
0.11%
jan 1, 2016
3.144
-0.022
-0.7%
Ranking of countries by current statistics by years


Comments: