29
/
en
AIzaSyAYiBZKx7MnpbEhh9jyipgxe19OcubqV5w
April 1, 2024
55414
Pre-demographic dividend
PRE
false
2
1
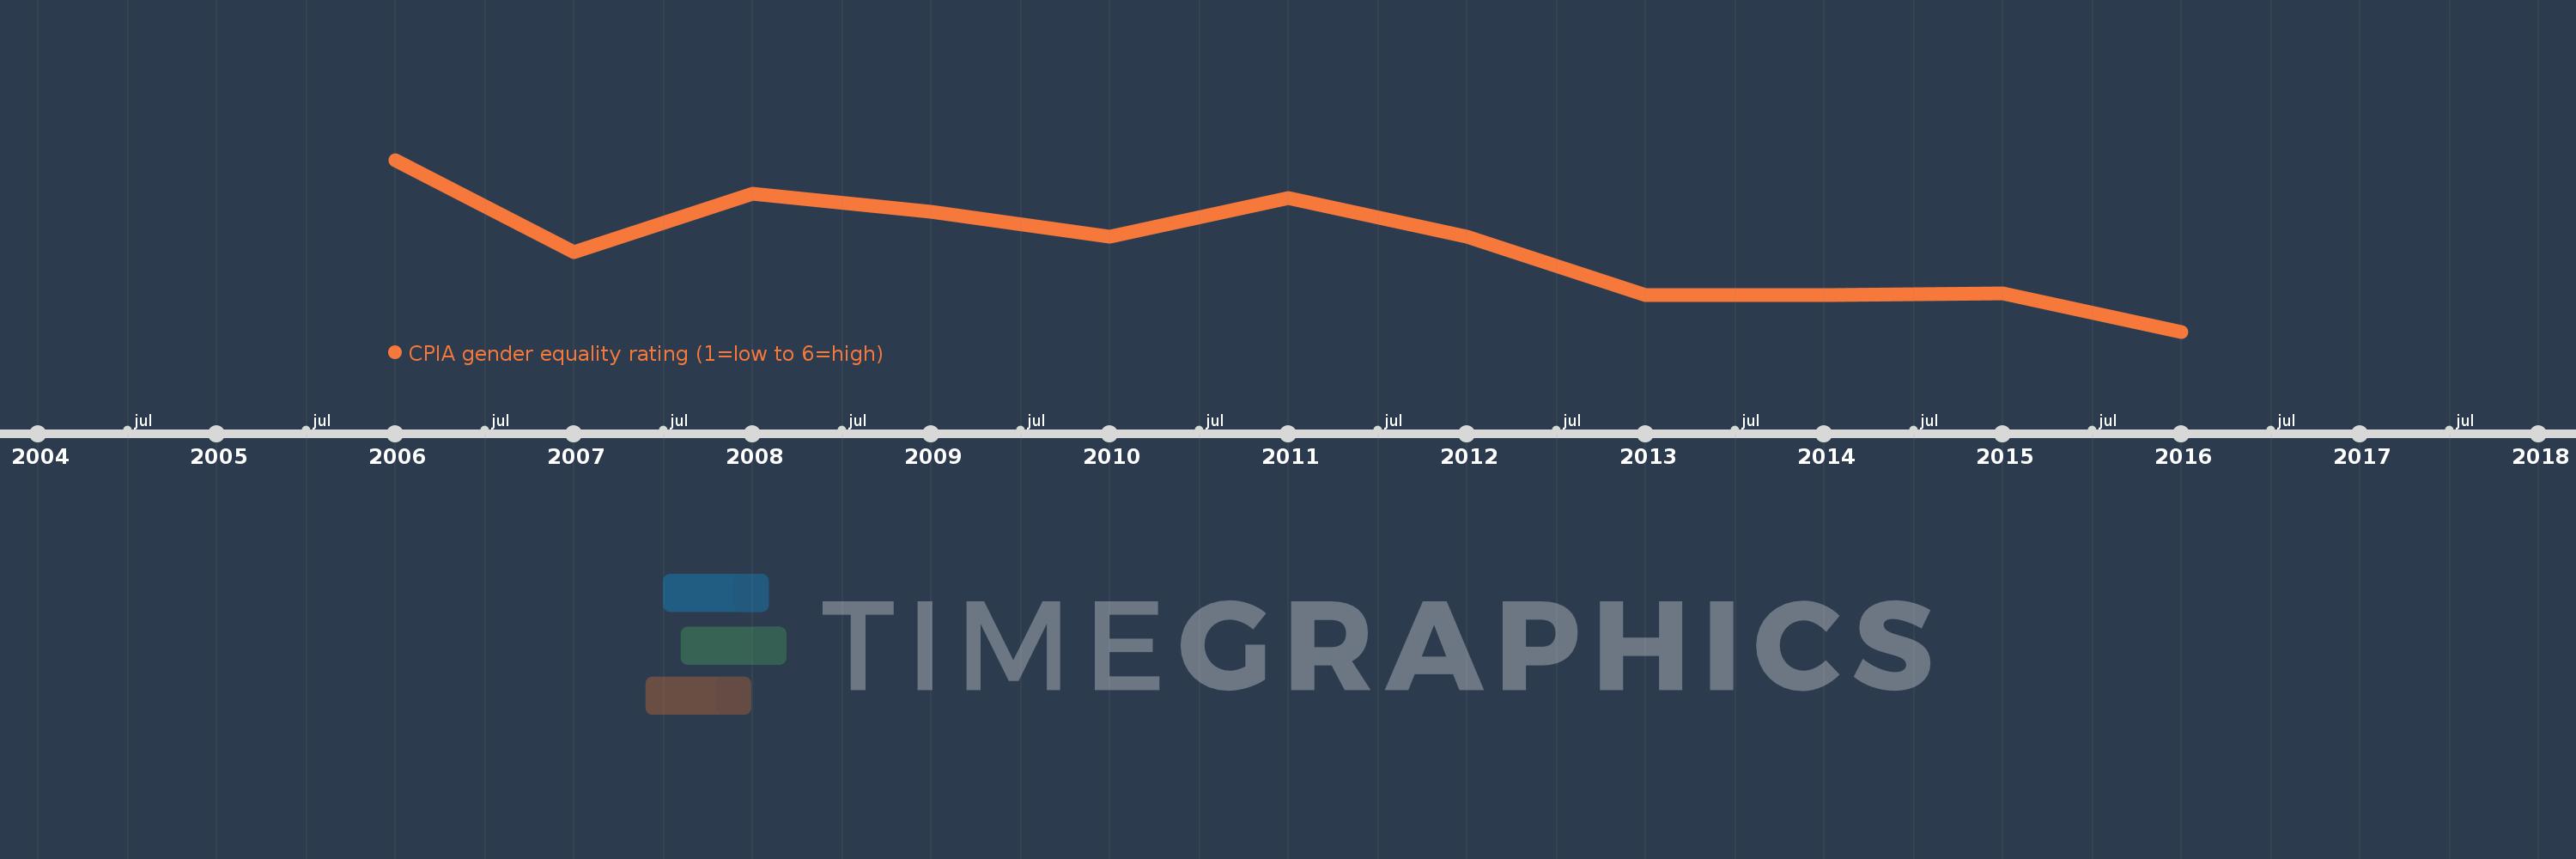
CPIA gender equality rating (1=low to 6=high)
2016,2015,2014,2013,2012,2011,2010,2009,2008,2007,2006
This statistics in other country:
Timeline:
This timeline shows a graph from 2006 to 2016 of Pre-demographic dividend. No data until 2005. Number of actual observations by date: 11.
Source name:
World Development Indicators
Source organization:
World Bank Group, CPIA database (http://www.worldbank.org/ida).
Categories, topics:
Public Sector
Last updated:
apr 23, 2017
Indicators value changes by year
At the date of observation
Value
Absolute change
Change from previous value
jan 1, 2006
3.183
+3.183
0.0%
jan 1, 2007
3.109
-0.074
-2.32%
jan 1, 2008
3.156
+0.047
1.51%
jan 1, 2009
3.141
-0.016
-0.5%
jan 1, 2010
3.121
-0.019
-0.62%
jan 1, 2011
3.152
+0.03
0.97%
jan 1, 2012
3.121
-0.03
-0.96%
jan 1, 2013
3.074
-0.048
-1.53%
jan 1, 2014
3.074
0.0
0.0%
jan 1, 2015
3.076
+0.002
0.07%
jan 1, 2016
3.045
-0.03
-0.99%
Ranking of countries by current statistics by years


Comments: