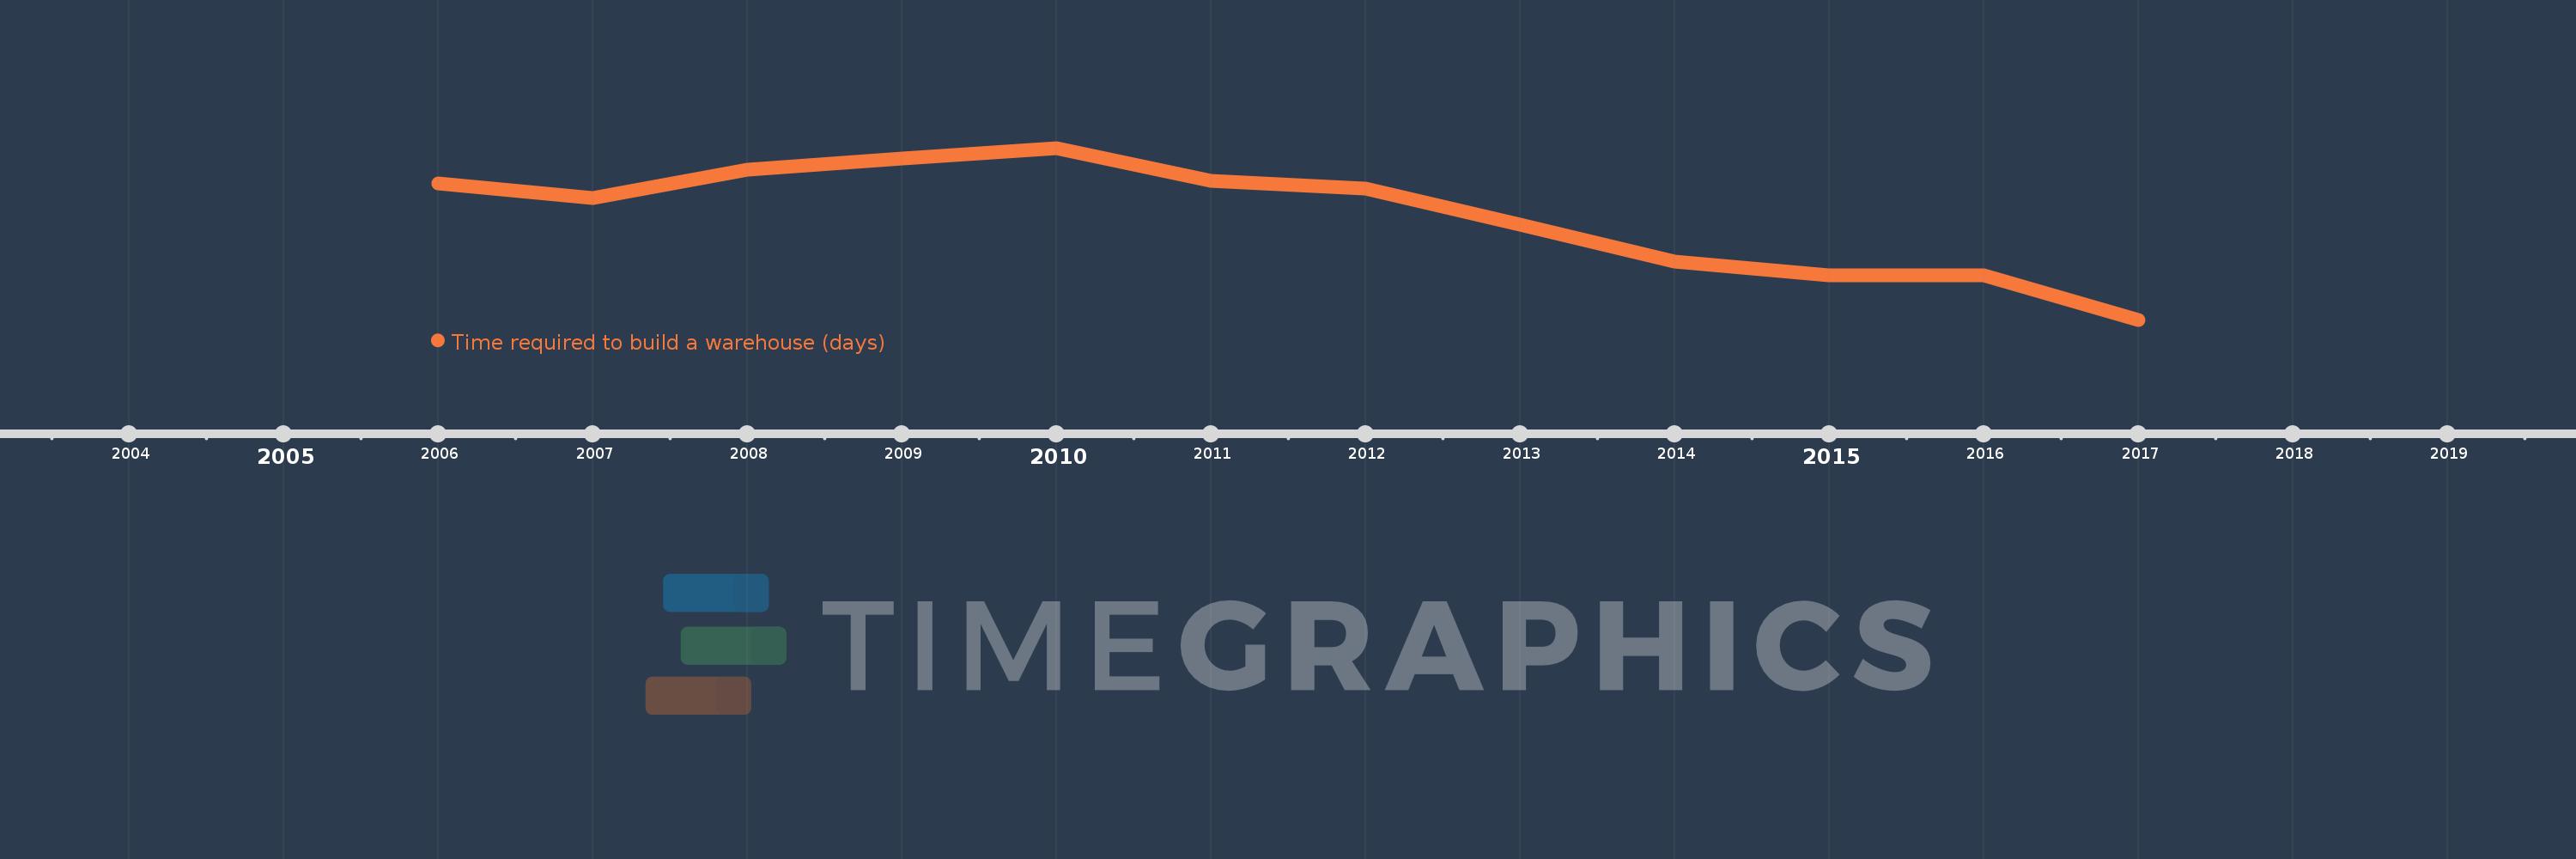
This timeline shows a graph from 2006 to 2017 of Fragile and conflict affected situations. No data until 2005. Number of actual observations by date: 12.
Source name:
World Development Indicators
Source organization:
World Bank, Doing Business project (http://www.doingbusiness.org/).
Categories, topics:
Private Sector
Last updated:
apr 23, 2017
Indicators value changes by year
Meaning:
183.236
Minimum:
159.533
jan 1, 2017
Maximum:
198.552
jan 1, 2010
At the date of observation
Value
Absolute change
Change from the previous value
jan 1, 2006
190.519
+190.519
0.0%
jan 1, 2007
187.214
-3.304
-1.73%
jan 1, 2008
193.607
+6.393
3.41%
jan 1, 2009
196.107
+2.5
1.29%
jan 1, 2010
198.552
+2.445
1.25%
jan 1, 2011
191.0
-7.552
-3.8%
jan 1, 2012
189.31
-1.69
-0.88%
jan 1, 2013
181.194
-8.117
-4.29%
jan 1, 2014
172.7
-8.494
-4.69%
jan 1, 2015
169.567
-3.133
-1.81%
jan 1, 2016
169.533
-0.033
-0.02%
jan 1, 2017
159.533
-10.0
-5.9%
Ranking of countries by current statistics by years
