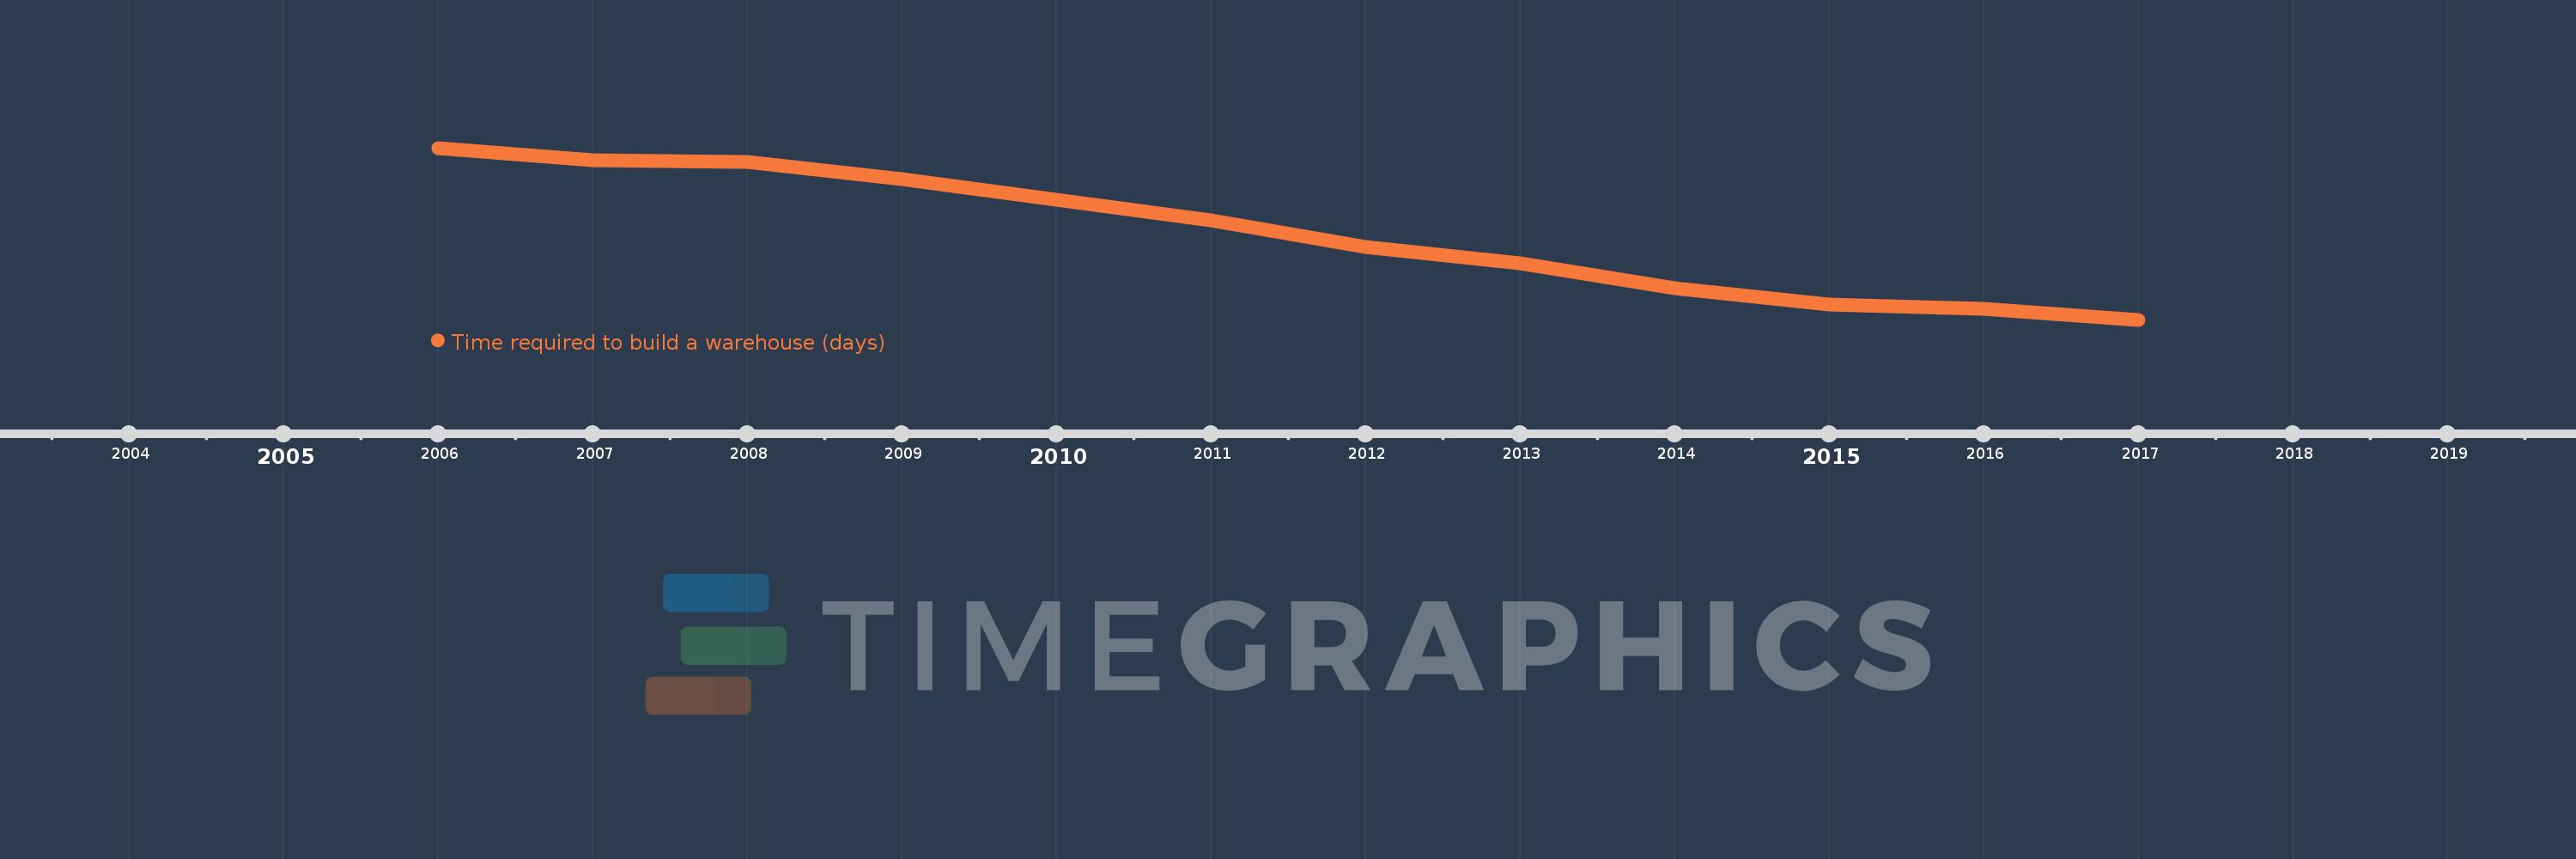
This timeline shows a graph from 2006 to 2017 of Europe & Central Asia (IDA & IBRD countries). No data until 2005. Number of actual observations by date: 12.
Source name:
World Development Indicators
Source organization:
World Bank, Doing Business project (http://www.doingbusiness.org/).
Categories, topics:
Private Sector
Last updated:
apr 23, 2017
Indicators value changes by year
Meaning:
222.274
Minimum:
148.514
jan 1, 2017
Maximum:
295.425
jan 1, 2006
At the date of observation
Value
Absolute change
Change from the previous value
jan 1, 2006
295.425
+295.425
0.0%
jan 1, 2007
285.119
-10.306
-3.49%
jan 1, 2008
283.262
-1.857
-0.65%
jan 1, 2009
269.024
-14.238
-5.03%
jan 1, 2010
251.25
-17.774
-6.61%
jan 1, 2011
233.205
-18.045
-7.18%
jan 1, 2012
210.429
-22.776
-9.77%
jan 1, 2013
196.619
-13.81
-6.56%
jan 1, 2014
175.167
-21.452
-10.91%
jan 1, 2015
161.705
-13.462
-7.69%
jan 1, 2016
157.576
-4.128
-2.55%
jan 1, 2017
148.514
-9.063
-5.75%
Ranking of countries by current statistics by years
